From Blueprint to Build: Mastering UML Component Diagrams with Visual Paradigm
Introduction: Why Component Diagrams Matter in Modern Software Architecture
As someone who’s navigated the complexities of system design for over a decade, I’ve learned that the difference between a maintainable system and a technical debt nightmare often comes down to one thing: clear architectural communication. That’s where UML Component Diagrams shine. They’re not just pretty boxes and arrows—they’re the blueprint that helps teams visualize how modular pieces fit together, understand dependencies, and plan for scalability.
Recently, I decided to deep-dive into component diagramming tools, and Visual Paradigm kept coming up in conversations with fellow architects. What started as a casual evaluation turned into a hands-on exploration of both traditional and AI-powered approaches to component modeling. In this guide, I’ll share my real-world experience, practical tips, and honest reflections on how to leverage component diagrams effectively—whether you’re documenting legacy systems or designing microservices from scratch.
What is Component Diagram?
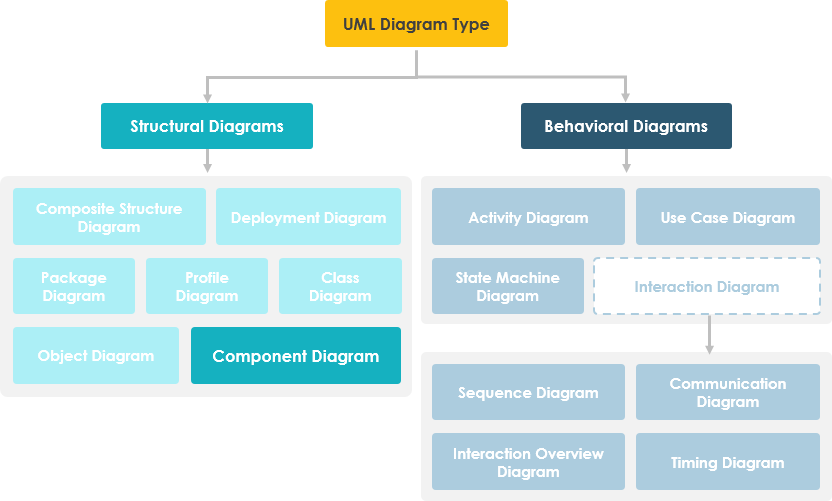
UML Component diagrams are used in modeling the physical aspects of object-oriented systems that are used for visualizing, specifying, and documenting component-based systems and also for constructing executable systems through forward and reverse engineering. Component diagrams are essentially class diagrams that focus on a system’s components that often used to model the static implementation view of a system.
Learn UML Faster, Better and Easier
Are you looking for a Free UML tool for learning UML faster, easier and quicker? Visual Paradigm Community Edition is a UML software that supports all UML diagram types. It is an international award-winning UML modeler, and yet it is easy-to-use, intuitive & completely free.
Component Diagram at a Glance
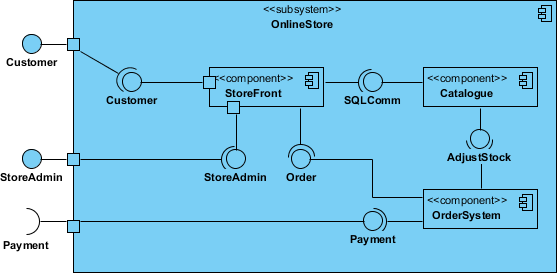
A component diagram breaks down the actual system under development into various high levels of functionality. Each component is responsible for one clear aim within the entire system and only interacts with other essential elements on a need-to-know basis.
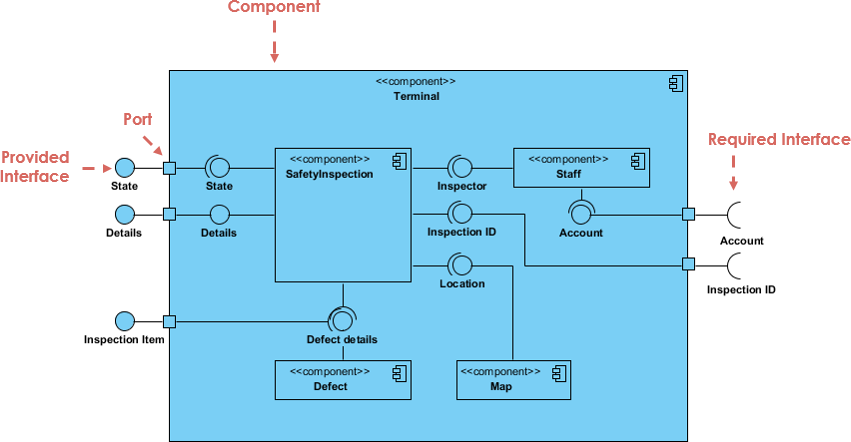
The example above shows the internal components of a larger component:
-
The data (account and inspection ID) flows into the component via the port on the right-hand side and is converted into a format the internal components can use. The interfaces on the right are known as required interfaces, which represents the services the component needed in order to carry out its duty.
-
The data then passes to and through several other components via various connections before it is output at the ports on the left. Those interfaces on the left are known as provided interface, which represents the services to deliver by the exhibiting component.
-
It is important to note that the internal components are surrounded by a large ‘box’ which can be the overall system itself (in which case there would not be a component symbol in the top right corner) or a subsystem or component of the overall system (in this case the ‘box’ is a component itself).
Basic Concepts of Component Diagram
A component represents a modular part of a system that encapsulates its contents and whose manifestation is replaceable within its environment. In UML 2, a component is drawn as a rectangle with optional compartments stacked vertically. A high-level, abstracted view of a component in UML 2 can be modeled as:
-
A rectangle with the component’s name
-
A rectangle with the component icon
-
A rectangle with the stereotype text and/or icon

Architect Your Modular Systems with AI
Component diagrams visualize the modular parts and physical manifestation of your system. Using Visual Paradigm’s AI Chatbot, you can instantly brainstorm system architectures, identify provided/required interfaces, and generate initial component diagrams through a simple conversational interface.
NOW AVAILABLEAI Chatbot: Your Design Partner
Simply describe your modules, microservices, or database structures to the chatbot. It will help you define:
-
Modular Boundaries: Identify which parts of your system should be encapsulated as components.
-
Dependency Mapping: Visualize how different executables and libraries interact within your release.
Learn more about our AI-driven modeling ecosystem:
AI Component Guide All AI Tools
Interface
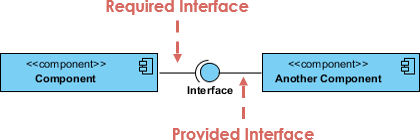
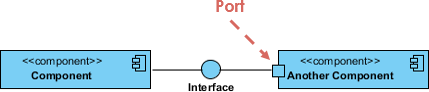
In the example below shows two type of component interfaces:
Provided interface symbols with a complete circle at their end represent an interface that the component provides – this “lollipop” symbol is shorthand for a realization relationship of an interface classifier.
Required Interface symbols with only a half circle at their end (a.k.a. sockets) represent an interface that the component requires (in both cases, the interface’s name is placed near the interface symbol itself).
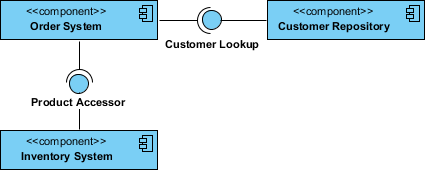
Component Diagram Example – Using Interface (Order System)
Subsystems
The subsystem classifier is a specialized version of a component classifier. Because of this, the subsystem notation element inherits all the same rules as the component notation element. The only difference is that a subsystem notation element has the keyword of subsystem instead of component.
Port
Ports are represented using a square along the edge of the system or a component. A port is often used to help expose required and provided interfaces of a component.
Relationships
Graphically, a component diagram is a collection of vertices and arcs and commonly contain components, interfaces and dependency, aggregation, constraint, generalization, association, and realization relationships. It may also contain notes and constraints.
| Relationships | Notation |
|---|---|
Association:
|
 |
Composition:
|
 |
Aggregation
|
 |
Constraint
|
 |
Dependency
|
 |
Links:
|
 |
Modeling Source Code
-
Either by forward or reverse engineering, identify the set of source code files of interest and model them as components stereotyped as files.
-
For larger systems, use packages to show groups of source code files.
-
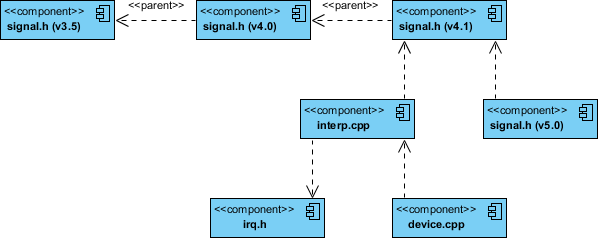
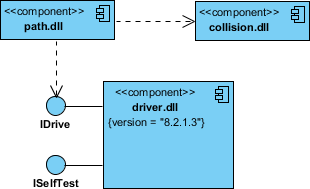
Consider exposing a tagged value indicating such information as the version number of the source code file, its author, and the date it was last changed. Use tools to manage the value of this tag.
-
Model the compilation dependencies among these files using dependencies. Again, use tools to help generate and manage these dependencies.
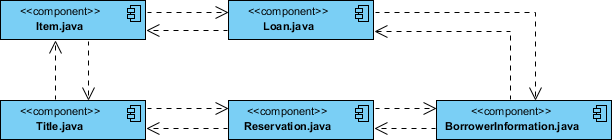
Component Example – Java Source Code
Component Diagram Example – C++ Code with versioning
Modeling an Executable Release
-
Identify the set of components you’d like to model. Typically, this will involve some or all the components that live on one node, or the distribution of these sets of components across all the nodes in the system.
-
Consider the stereotype of each component in this set. For most systems, you’ll find a small number of different kinds of components (such as executables, libraries, tables, files, and documents). You can use the UML’s extensibility mechanisms to provide visual cues(clues) for these stereotypes.
-
For each component in this set, consider its relationship to its neighbors. Most often, this will involve interfaces that are exported (realized) by certain components and then imported (used) by others. If you want to expose the seams in your system, model these interfaces explicitly. If you want your model at a higher level of abstraction, elide these relationships by showing only dependencies among the components.
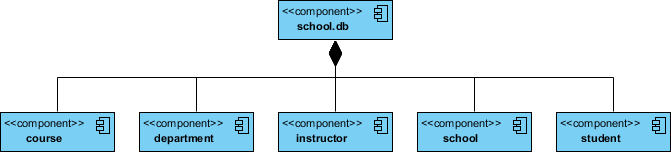
Modeling a Physical Database
-
Identify the classes in your model that represent your logical database schema.
-
Select a strategy for mapping these classes to tables. You will also want to consider the physical distribution of your databases. Your mapping strategy will be affected by the location in which you want your data to live on your deployed system.
-
To visualize, specify, construct, and document your mapping, create a component diagram that contains components stereotyped as tables.
-
Where possible, use tools to help you transform your logical design into a physical design.
How to Draw a Component Diagram in UML?
Component Diagrams show the types of software components in the system, their interfaces and dependencies. People often use UML Component Diagram in the following scenarios:
-
Show the structure of the code itself
-
Can be used to hide the specification detail (i.e., information hiding) and focus on the relationship between components
-
Model the structure of software releases; show how components integrate with current system design
-
Model source code and relationships between files
-
Specify the files that are compiled into an executable
How to create Component Diagrams?
The steps below outline the major steps to take in creating a UML Component Diagram.
-
Decide on the purpose of the diagram
-
Add components to the diagram, grouping them within other components if appropriate
-
Add other elements to the diagram, such as classes, objects and interfaces
-
Add the dependencies between the elements of the diagram
Creating a Component Diagram
-
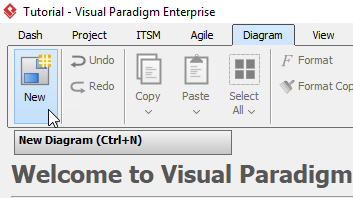
Click Diagram > New from the toolbar.
-
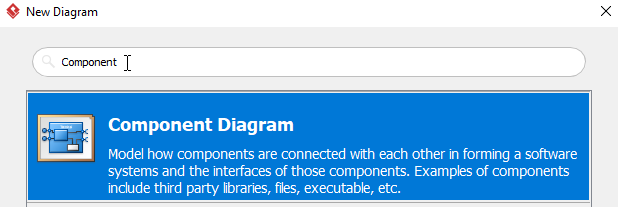
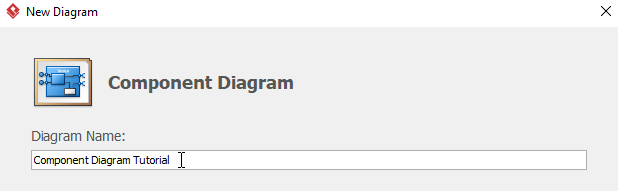
In the New Diagram window, select Component Diagram, then click Next. You can use the search bar above to filter results.
-
Name the diagram, then click OK. You will then see a blank diagram. We will name the diagram Component Diagram Tutorial in this tutorial.
-
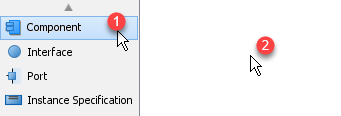
To create a component, select Component, then click any empty space on the diagram.
-
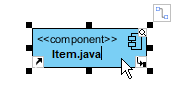
Rename the component by double clicking the component. In this case, we will be renaming this component Item.java.
-
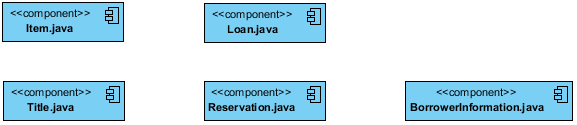
Repeat step 4 and 5 for more components. You will see something like this after creating all components:
-
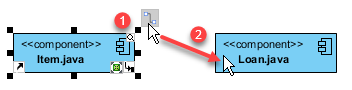
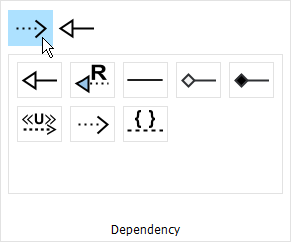
We can create some dependencies once the components are created. In this example, we are creating a dependency from Item.java to Loan.java. Click Item.java, then click and hold the resource button Resource Catalog, drag the cursor to Loan and release, select Dependency from the popup window. You will now see a dependency from Item.java to Loan.java.
-
Repeat step 7 for more dependencies.
-
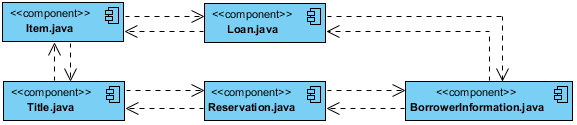
You will see something like this when you finished your diagram:
New in OpenDocs: AI-Powered Component Diagram Support – Generate UML Component Diagrams Effortlessly
We’re excited to announce the latest enhancement to OpenDocs, our AI-powered knowledge management tool designed for creating, managing, and sharing rich documentation and diagrams. Today, we’re rolling out support for three powerful new diagram types: EPC diagrams, Component diagrams, and PERT charts. In this update spotlight, we dive into the brand-new Component diagram capability – powered by AI for lightning-fast creation.
Introducing the AI Component Diagram Tool in OpenDocs
OpenDocs continues to evolve as your go-to AI-powered knowledge management tool for professionals who need clarity, productivity, and collaboration in their documentation workflows. With the addition of Component diagram support, software architects, system engineers, and developers can now visualize modular system structures more efficiently than ever.
A UML Component diagram (also known as Component diagram) illustrates the organization and wiring of software components, their provided and required interfaces, ports, and dependencies. It provides a high-level static implementation view of a system, making it essential for modeling component-based architectures, dependencies between modules, and deployment considerations.
Thanks to our advanced AI Component diagram generator, you no longer need to build these diagrams manually from scratch. Simply describe your system in natural language (e.g., “A web application with authentication service, database connector, and payment gateway components”), and our AI Component diagram tool will automatically generate a professional, editable UML Component diagram in seconds.
Key Benefits of the New AI Component Diagram Generator
-
Instant Diagram Creation: Leverage the AI Component diagram generator to turn text descriptions into fully structured Component diagrams – saving hours of manual work.
-
Seamless Integration in Documentation: Embed your generated Component diagram directly into any OpenDocs page as a live component, or create a dedicated Component Page for focused editing and viewing.
-
Boost Productivity & Clarity: Combine powerful visuals with rich text in our AI-powered knowledge management tool to explain complex software architectures with unparalleled precision.
-
Full Editing Power: After AI generation, refine shapes, interfaces, ports, connectors, and relationships using OpenDocs’ intuitive diagram editor.
-
Perfect for Software Teams: Ideal for system architects, software engineers, and analysts documenting modular designs, microservices, or legacy system integrations.
How to create a UML Component Diagram with AI?
-
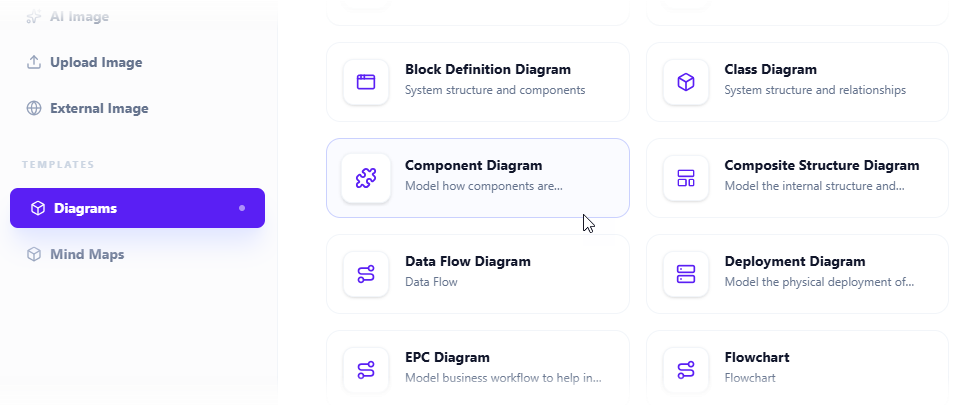
Click on the Insert button in the top bar of your document editor.

-
The Insert dialog box is opened. Select Diagrams tab on the left, and then Component Diagram on the right.
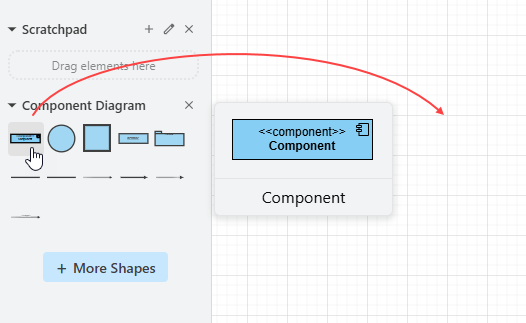
-
This opens the diagram editor. You can draw the component diagram using the symbols on the palette (Just drag and drop a symbol onto the diagram canvas).
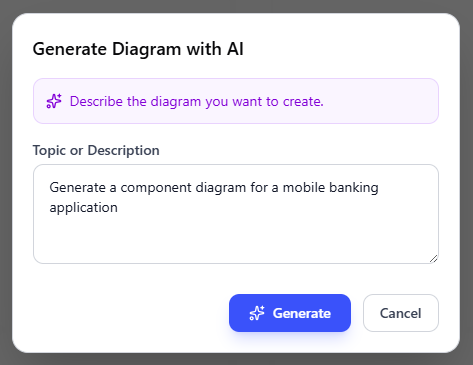
To generate a diagram with AI, click on Create with AI at the top right.

-
Describe your problem in the input box. Click Generate.
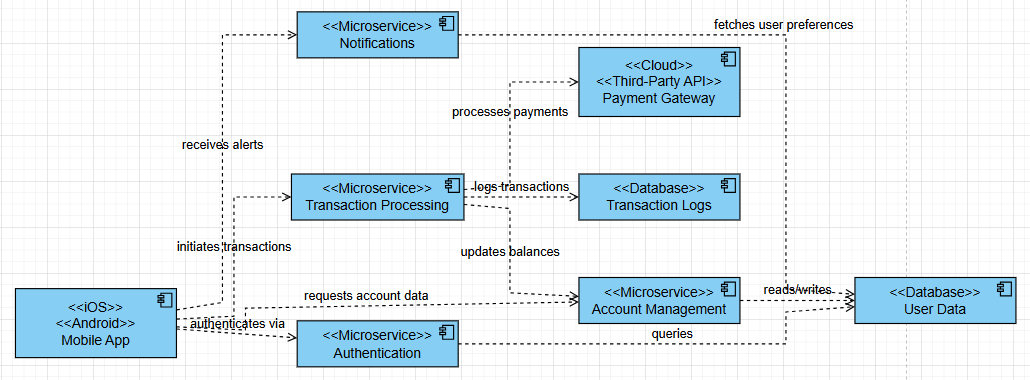
-
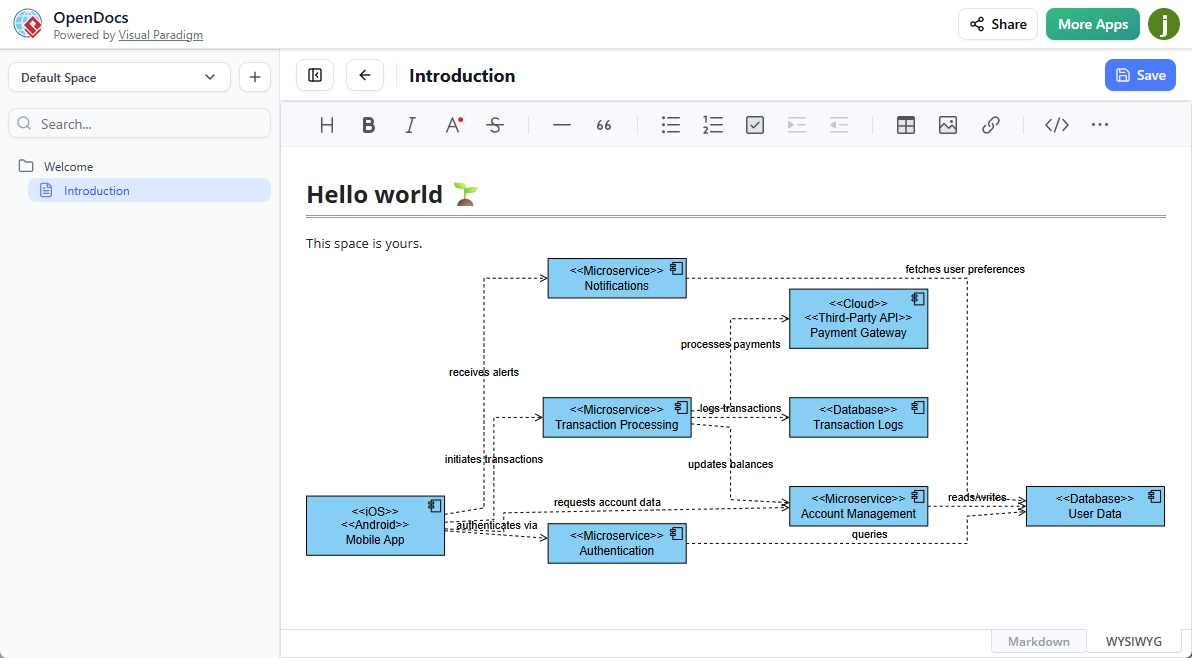
AI will analyze your problem and generate a component diagram accordingly. Below is an example generated.
-
You may touch up the component diagram by adjusting the layout, adding new shapes, etc.
-
Click Save at the top right.
-
Click Close to return to the document editor. The diagram is embedded into your document.
Try the AI Component Diagram Generator Today!
Ready to experience faster, smarter diagramming in our AI-powered knowledge management tool? Head over to OpenDocs and start generating UML Component diagrams with AI right now.
Try OpenDocs Now – Launch the AI Component Diagram Tool
For full details on this feature and how to embed or manage Component diagrams in your documents, visit our dedicated OpenDocs landing page.
Stay tuned for more updates as we continue expanding diagram types and AI capabilities in OpenDocs!
OpenDocs is available with Visual Paradigm Online (Combo Edition) or Visual Paradigm (Professional Edition) licenses.
My Hands-On Experience: Two Paths to Component Diagram Mastery
Visual Paradigm offers two distinct ways to build Component Diagrams: a Traditional manual approach for precision and an AI-Powered method for rapid prototyping. [1, 2]
AI Component Diagram Generator: New AI UML Tool Feature
AI Chatbot | Diagramming & Modeling with Visual Paradigm
Visual Paradigm AI: Advanced Software & Intelligent Apps
1. Traditional Method (Manual Precision)
The traditional approach is ideal for architects who need total control over standard UML Component Diagram notation.
-
Setup: Navigate to Diagram > New from the toolbar, select Component Diagram, and name your project.
-
Building Elements:
-
Components: Select Component from the floating toolbar and click the canvas to place it.
-
Interfaces: Move your mouse over a component and use the Resource Catalog button (drag it out) to create “Provided” (lollipop) or “Required” (socket) interfaces.
-
Dependencies: Drag from one component to another using the Resource Catalog and select Dependency to show how modules interact.
-
-
Customization: You can right-click any element to add Stereotypes (e.g., <>) or toggle visibility of attributes and operations via Presentation Options. [3, 4, 5]
2. AI-Powered Method (Generative Speed)
The AI Diagram Generator uses natural language processing to turn text descriptions into fully editable models in seconds. [6, 7]
-
Generation Workflow:
-
Go to the Tools menu and select AI Diagram Generation.
-
Select Component Diagram from the dropdown menu.
-
Enter a descriptive prompt (e.g., “Generate a component diagram for an e-commerce system with Payment, Inventory, and Shipping services”).
-
Click OK to generate the initial draft with balanced layouts and proper relationships.
-
-
Conversational Editing: You can use the AI Chatbot to refine the result. Commands like “Rename ‘Stock’ to ‘Inventory Manager'” or “Add a required interface for the Database” are executed instantly.
-
Integration: AI-generated diagrams aren’t just static images; they are model-based, meaning you can import them into the main Visual Paradigm Desktop app for deep engineering like code generation or version control. [6, 7, 8, 9, 10, 11]
Which Approach to Choose?
| Feature [1, 6, 7, 12, 13] | Traditional | AI-Powered |
|---|---|---|
| Best For | Final production blueprints | Rapid prototyping & brainstorming |
| Effort | Manual placement of every shape | Instant generation from text |
| Customization | Full manual control | Iterative chatbot requests |
| Access | All editions | Professional Edition or higher with maintenance |
If you’d like, I can help you:
-
Draft a specific prompt for your system architecture
-
Explain how to map interfaces between your components
-
List the hardware requirements for running the desktop version
Let me know how you’d like to start your diagram.
Conclusion: Choosing Your Path Forward
After spending weeks experimenting with both approaches, my takeaway is simple: there’s no single “best” way to create component diagrams—it depends entirely on your context.
When I’m documenting a regulated financial system where every dependency must be auditable, I reach for the traditional method. The granular control helps me ensure compliance and precision. But when I’m in a sprint planning session, sketching out a new microservice architecture with my team? The AI-powered generator is a game-changer. It turns a 2-hour whiteboarding session into a 10-minute collaborative refinement exercise.
What impressed me most about Visual Paradigm’s ecosystem is how seamlessly these two approaches complement each other. I can start with an AI-generated draft, then switch to manual mode to fine-tune interfaces or add versioning metadata. That flexibility—paired with robust export options and team collaboration features—makes it a tool that grows with your project’s complexity.
My advice? Start with the free Community Edition to learn the fundamentals. Once you understand the notation and relationships, evaluate whether AI acceleration fits your workflow. And remember: the best component diagram isn’t the most beautiful one—it’s the one that helps your team build better software, faster.
References
- Hands-on Review of Visual Paradigm’s AI-Powered UML Component Diagrams: A detailed third-party evaluation of Visual Paradigm’s AI features for generating and editing UML component diagrams, including practical use cases and performance insights.
- Beginner’s Guide to Component Diagrams in UML: An introductory tutorial covering core concepts, notation standards, and step-by-step instructions for creating component diagrams in UML.
- Drawing Component Diagrams – Visual Paradigm User Guide: Official documentation explaining the technical steps for creating and customizing component diagrams within Visual Paradigm’s desktop application.
- How to Draw Component Diagram in UML Tutorial: A visual, screenshot-driven tutorial walking users through the complete workflow of building a component diagram from scratch.
- Mastering UML Component Diagrams: A Hands-on Review: An in-depth analysis of advanced component diagram techniques, including subsystem modeling, port configuration, and dependency management.
- AI Diagram Generation Feature Overview: Official feature page describing Visual Paradigm’s AI-powered diagram generation capabilities across multiple UML diagram types.
- AI Diagram Generator Release Notes: Product update announcement detailing the initial launch of AI diagram generation features, supported diagram types, and integration workflows.
- AI Component Diagram Generator Update: Specific release notes for the component diagram AI generator, including new capabilities, prompt engineering tips, and editing enhancements.
- Guide to AI-Powered UML Diagram Generation (English): Interactive chatbot guide demonstrating how to use natural language prompts to generate and refine UML diagrams via Visual Paradigm’s AI assistant.
- Guide to AI-Powered UML Diagram Generation (Vietnamese): Vietnamese-language version of the AI diagram generation guide, expanding accessibility for global development teams.
- Video Tutorial: AI Component Diagram Generation: Step-by-step video demonstration showing the end-to-end process of creating a component diagram using Visual Paradigm’s AI tools.
- AI Diagram Generator Launch Announcement: Official blog post announcing the broader AI diagram generation initiative, including vision, roadmap, and early user testimonials.
- OpenDocs AI Component Diagram Integration: Landing page for OpenDocs, Visual Paradigm’s AI-powered knowledge management platform featuring embedded component diagram creation and collaboration.


Comments (0)