![Free eBooks of IT [BooksOfAll]](https://www.booksofall.com/wp-content/uploads/2022/06/booksofall-logo-2.png)
Mastering BPMN: A Visual Paradigm Guide to Complex Business Process Modeling
Business Process Model and Notation (BPMN) is the industry standard for visually representing business workflows. It serves as a bridge between business analysts and technical stakeholders, translating complex operational logic into an intuitive graphical language. In this tutorial, we will explore the architecture of a specific BPMN diagram using Visual Paradigm, focusing on the management of a high-stakes process like the Nobel Prize nomination.
By analyzing this model, we will learn how to structure processes using Swimlanes, manage data persistence, and handle decision logic effectively.
1. Understanding BPMN Architecture
BPMN is not just a flowchart; it is a comprehensive modeling language. To understand the diagram provided, we must first break down its structural components:
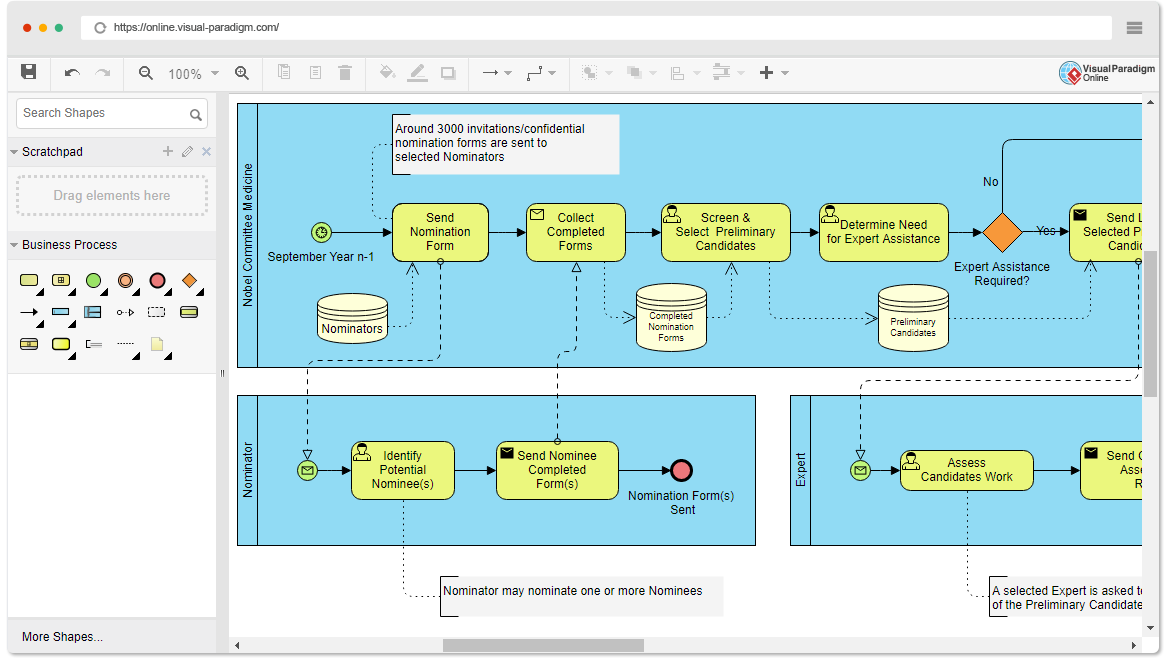
- Pool (The System): The large blue rectangle represents the entire business process system (e.g., “Nobel Committee Medicine”). It encapsulates the scope of the process.
- Swimlanes (Partitions): These are the horizontal sub-divisions within the Pool. In our diagram, they represent Nobel Committee Medicine, Nominator, and Expert. Swimlanes are crucial because they clearly assign responsibility for specific tasks to specific roles or departments.
- Flow Objects:
- Events (Circles): Represent something that happens (Start, Intermediate, End). For example, the green circle with a clock icon represents a time-based start event.
- Activities (Rounded Rectangles): The work being done (Tasks or Sub-processes). The yellow boxes are standard Tasks.
- Gateways (Diamonds): Decision points where the process splits or merges. The orange diamond asks, “Expert Assistance Required?”.
- Data Objects: Represented by cylinder icons, these are the data stores or files involved in the process, such as “Completed Nomination Forms”.
2. Step-by-Step: Modeling the Nobel Committee Workflow
Visual Paradigm simplifies the creation of these complex diagrams. Let’s walk through how this specific model is constructed and interpreted.
Phase A: The Trigger (Start Event)
The process begins with a Start Event inside the “Nobel Committee Medicine” lane. The icon features a clock, indicating a Timer Event. This suggests the process is time-sensitive, triggered specifically on “September Year n-1”. In BPMN, this ensures that the workflow aligns with calendar deadlines.
Phase B: Task Execution and Data Interaction
The workflow proceeds through a sequence of tasks:
- Send Nomination Form: The committee initiates the process.
- Collect Completed Forms: The system waits for input.
- Screen & Select: The committee reviews the data.
Data Association: Notice the dashed lines connecting tasks to the data cylinders (e.g., “Nominators”, “Completed Nomination Forms”). In Visual Paradigm, these are called Data Associations. They are critical because they show what data is read or written during a task. For instance, “Collect Completed Forms” reads data from the “Nominators” data store.
Phase C: Parallelism and Collaboration
The diagram demonstrates a sophisticated feature: Parallel Process Collaboration.
When the main process (Committee) reaches a decision point (the orange diamond), it splits based on a condition. However, the diagram also shows that the “Nominator” and “Expert” lanes operate in parallel. The dashed arrows crossing the swimlane boundaries represent Message Flows or communication between different participants. This allows the modeler to show how the Committee talks to the Nominators and Experts without cluttering the single linear flow.
3. Implementing Decision Logic with Gateways
One of the most powerful features of BPMN is the Gateway. In this diagram, the orange diamond represents an Inclusive Gateway (or potentially an Exclusive Gateway, depending on the strictness of the logic).
The logic flow is as follows:
- The Committee reaches the “Determine Need for Expert Assistance” task.
- The Gateway asks: Is Expert Assistance Required?
- Yes Path: The flow moves to “Send Selected Candidates” and loops back or proceeds to the Expert lane.
- No Path: The flow bypasses the expert assessment step and moves directly to the final selection.
4. Using Visual Paradigm for Advanced Modeling
Visual Paradigm provides the tools necessary to build this architecture without requiring manual drawing. The software enforces BPMN standards, ensuring that your diagrams are readable and valid.
- Drag-and-Drop Interface: As seen in the screenshot, the “Scratchpad” and “Business Process” palettes allow users to drag Events, Tasks, and Gateways directly onto the canvas.
- Auto-Layout: Visual Paradigm can automatically arrange these shapes to ensure a clean, readable flow, preventing the “spaghetti code” look common in manual diagrams.
- Validation: The tool checks for common errors, such as missing start/end events or disconnected gateways.
Conclusion
The Nobel Committee process diagram serves as an excellent example of how BPMN handles complexity. By using Swimlanes, we separate concerns between the Committee, Nominators, and Experts. By using Gateways, we handle conditional logic. And by using Data Objects, we track the lifecycle of the nomination forms.
Visual Paradigm empowers organizations to not just draw these diagrams, but to execute them. With features like report generation and team collaboration, teams can ensure that their business processes are not only well-documented but also optimized for efficiency.