![Free eBooks of IT [BooksOfAll]](https://www.booksofall.com/wp-content/uploads/2022/06/booksofall-logo-2.png)
Building the Nobel Prize Nomination Workflow with Visual Paradigm BPMN 2.0
In the complex landscape of modern enterprise software, the ability to clearly map out business processes is no longer a “nice-to-have”—it is a critical necessity. For years, business analysts and developers have often spoken different languages. Analysts focus on workflow efficiency and stakeholder needs, while developers prioritize system architecture and code logic. This disconnect frequently leads to misaligned expectations, scope creep, and inefficient implementations.
Enter Visual Paradigm, a tool that promises to bridge this divide by offering a fully comprehensive, standards-compliant BPMN 2.0 modeling platform. This tutorial breaks down the architecture of a complex process: The Nobel Prize Nomination Workflow. By analyzing this diagram, we will explore how to structure complex data flows, manage concurrent processes, and handle conditional logic using Visual Paradigm.
Understanding the Process Architecture
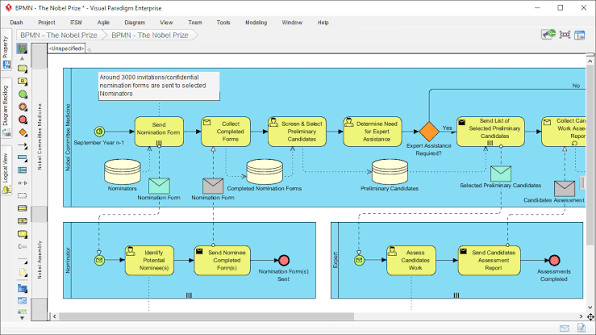
The diagram presented utilizes a Pool and Lane architecture, a fundamental concept in BPMN 2.0. This structure allows us to visualize the interaction between different entities within the same process.
- The Pool (Nobel Prize): Represented by the large outer container, this defines the scope of the entire process. It encapsulates the entire lifecycle of the Nobel Prize nomination.
- The Lanes (Organizations): The pool is divided into three distinct horizontal lanes:
- Organization: Responsible for the initial intake of nominations and the final selection of candidates.
- Nominator: Represents the external parties (individuals or entities) who submit the nomination forms.
- Expert: Represents the specialized reviewers who assess the validity and quality of the nominees.
Phase 1: The Intake Process (Organization Lane)
The process begins in the top lane, managed by the Organization. This phase is critical for data collection and initial triage.
The workflow starts with a Start Event (indicated by the white circle), which triggers the sending of approximately 3,000 confidential nomination forms. As the process moves forward, we see a Gateway (the diamond shape) acting as a decision point. This specific gateway asks: “Expert Assistance Required?”
If the answer is “Yes”, the process flows to the right, branching into a subprocess or a parallel activity where the organization sends a list of selected preliminary candidates to the Expert lane. If the answer is “No”, the process continues to collect work area data, managing the flow of information through various data stores represented by the cylinder icons.
Phase 2: Parallel Execution and Collaboration
One of the most powerful features of BPMN is the ability to model parallel execution. In this diagram, we see how the Organization and the Nominator lanes interact simultaneously.
While the Organization is screening candidates, the Nominator is performing the initial data entry. This is visualized using Message Flows (dashed lines with open arrowheads) connecting the two lanes. For instance, the “Nomination Form” is a message passed from the Nominator to the Organization.
The diagram also illustrates the “Send Nominee Completed Forms” task, which utilizes a Send Task (indicated by the envelope icon). This signifies that the action involves transmitting data out of the current system scope or to another participant.
Phase 3: Expert Assessment and Decision Logic
The bottom section of the diagram highlights the Expert lane. This is where the technical or specialized validation occurs. The process here involves identifying potential nominees and sending them a “Nominee Assessment Work” package.
The workflow culminates in the “Send Candidates Assessment Report” task. Notice the use of a Terminating End Event (the red circle with a thick border). This indicates that once this specific report is sent, the sub-process for that specific candidate concludes. The loop back arrow suggests a potential for re-evaluation or a continuous cycle of assessment.
Key Technical Concepts in Visual Paradigm
To recreate a diagram of this complexity, Visual Paradigm provides specific modeling elements that must be mastered:
- Gateways: The diamond shapes are not just connectors; they are logic gates. The diagram uses an Inclusive Gateway (indicated by the circle with a dot inside), meaning that if the condition “Expert Assistance Required” is met, the “Yes” path is taken, but other paths might also be active.
- Data Objects: The document icons (e.g., “Nomination Form”, “Completed Nomination Forms”) act as data stores or artifacts. They are crucial for understanding what information is being transformed at each step.
- Swimlanes: By strictly adhering to the Lane boundaries, the model ensures that it is clear which role is responsible for which task. This prevents ambiguity in the “Who does what” analysis.
Conclusion
The Nobel Prize Nomination workflow demonstrates how Visual Paradigm can handle intricate business logic involving multiple stakeholders, conditional branching, and data exchange. By mapping these processes visually, organizations can identify bottlenecks—such as the “Expert Assistance” decision point—and optimize their operational efficiency.
Whether you are a seasoned business analyst or a technical developer, mastering these modeling techniques in Visual Paradigm ensures that your implementation matches the real-world complexity of your enterprise.