
Introduction
Data Flow Diagrams (DFDs) are foundational tools in systems analysis and software engineering, providing a clear visual representation of how data moves through a system. Unlike flowcharts that focus on control flow and decision logic, DFDs emphasize the transformation, storage, and movement of information itself. This makes them invaluable for understanding complex business processes, identifying bottlenecks, and ensuring that all data requirements are properly addressed before development begins.
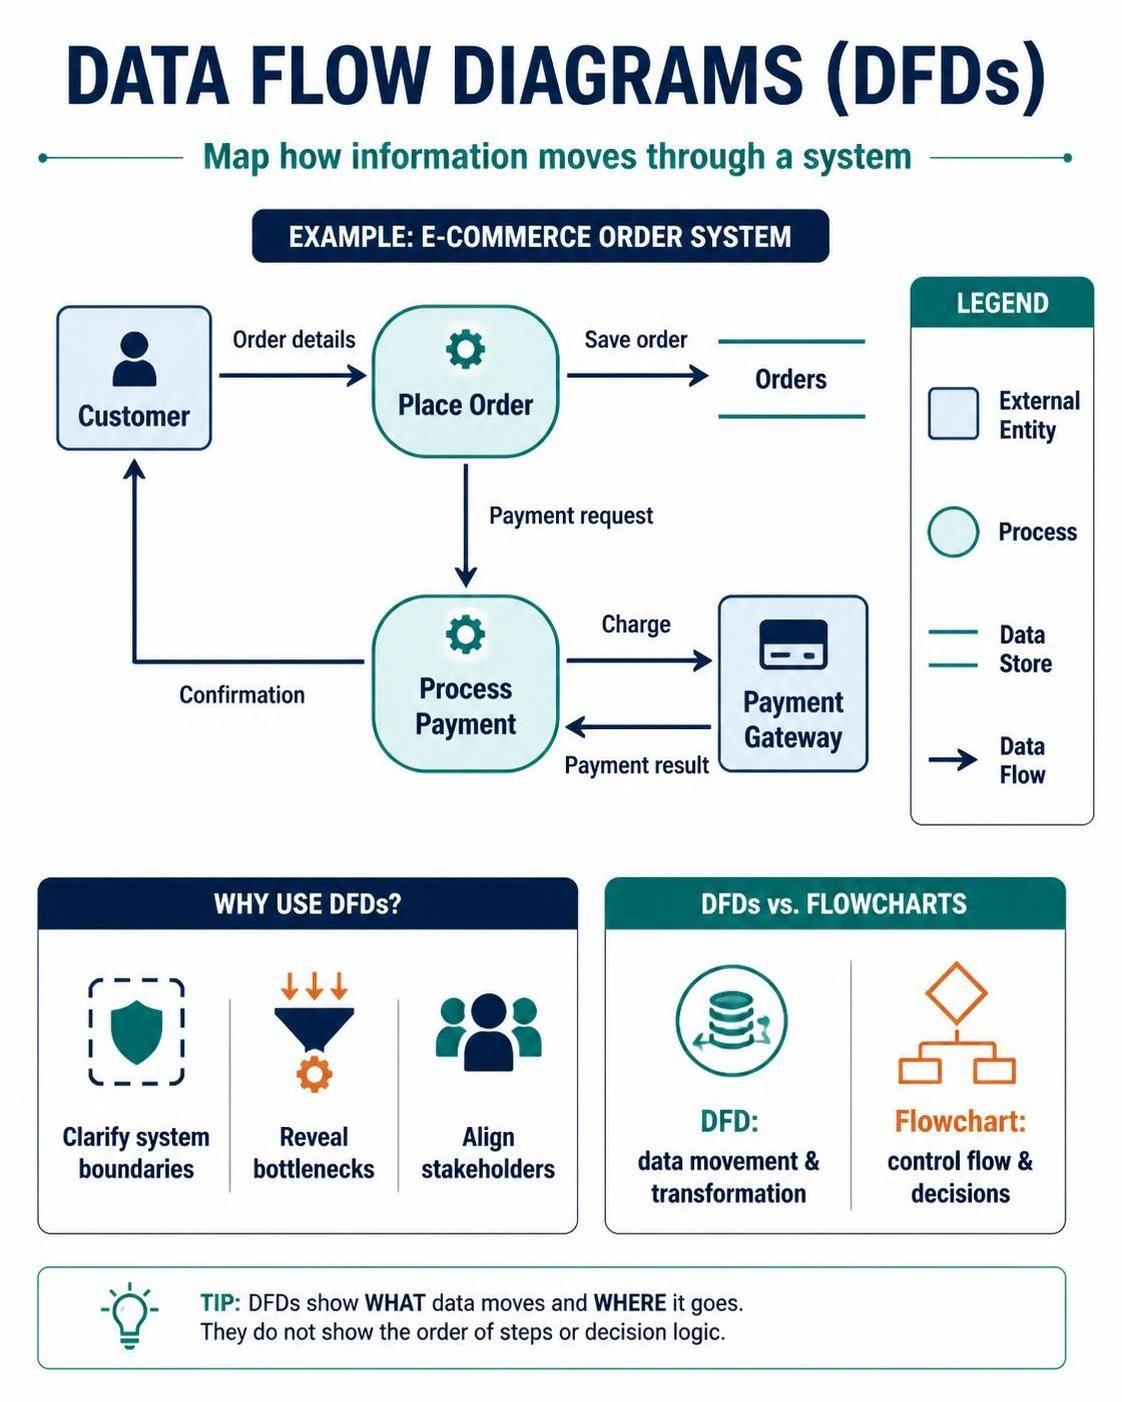
Whether you’re designing an e-commerce platform, a hospital records system, or an enterprise resource planning solution, DFDs help stakeholders—from business analysts to developers—share a common understanding of system boundaries and data interactions. This guide will walk you through the core concepts of DFDs, demonstrate how to create them using Visual Paradigm’s powerful tooling, and provide practical examples to help you master this essential modeling technique.
Key Concepts of Data Flow Diagrams
The Four Core Elements
Every DFD consists of four fundamental components that work together to map data movement:
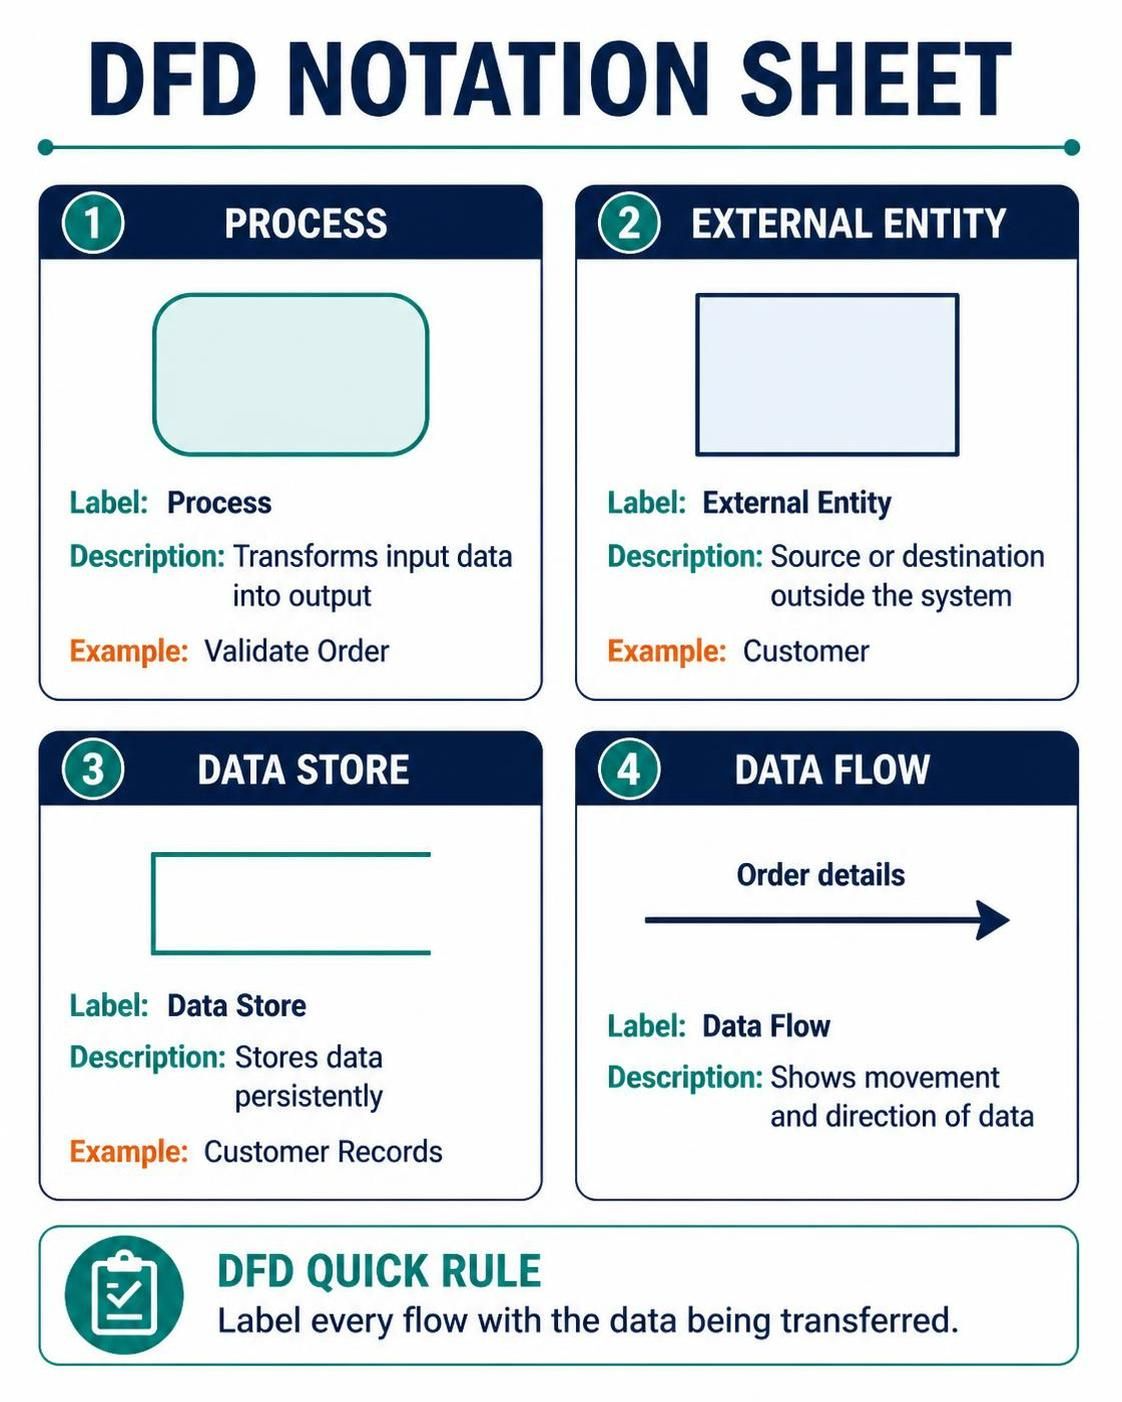
1. Process (Rounded Rectangle)
A process represents any activity that transforms input data into output data. Processes are the heart of your DFD, showing where value is added to information. Each process should have a clear verb-noun name that describes its function, such as “Validate Order” or “Calculate Tax.”
Example: In an online shopping system, “Process Payment” would take credit card details and order total as inputs, perform validation and authorization, then output a payment confirmation or rejection.
2. External Entity (Square/Rectangle)
Also called terminators, external entities represent people, organizations, or systems outside your system boundary that interact with it. They are sources or destinations of data but are not part of the system being modeled.
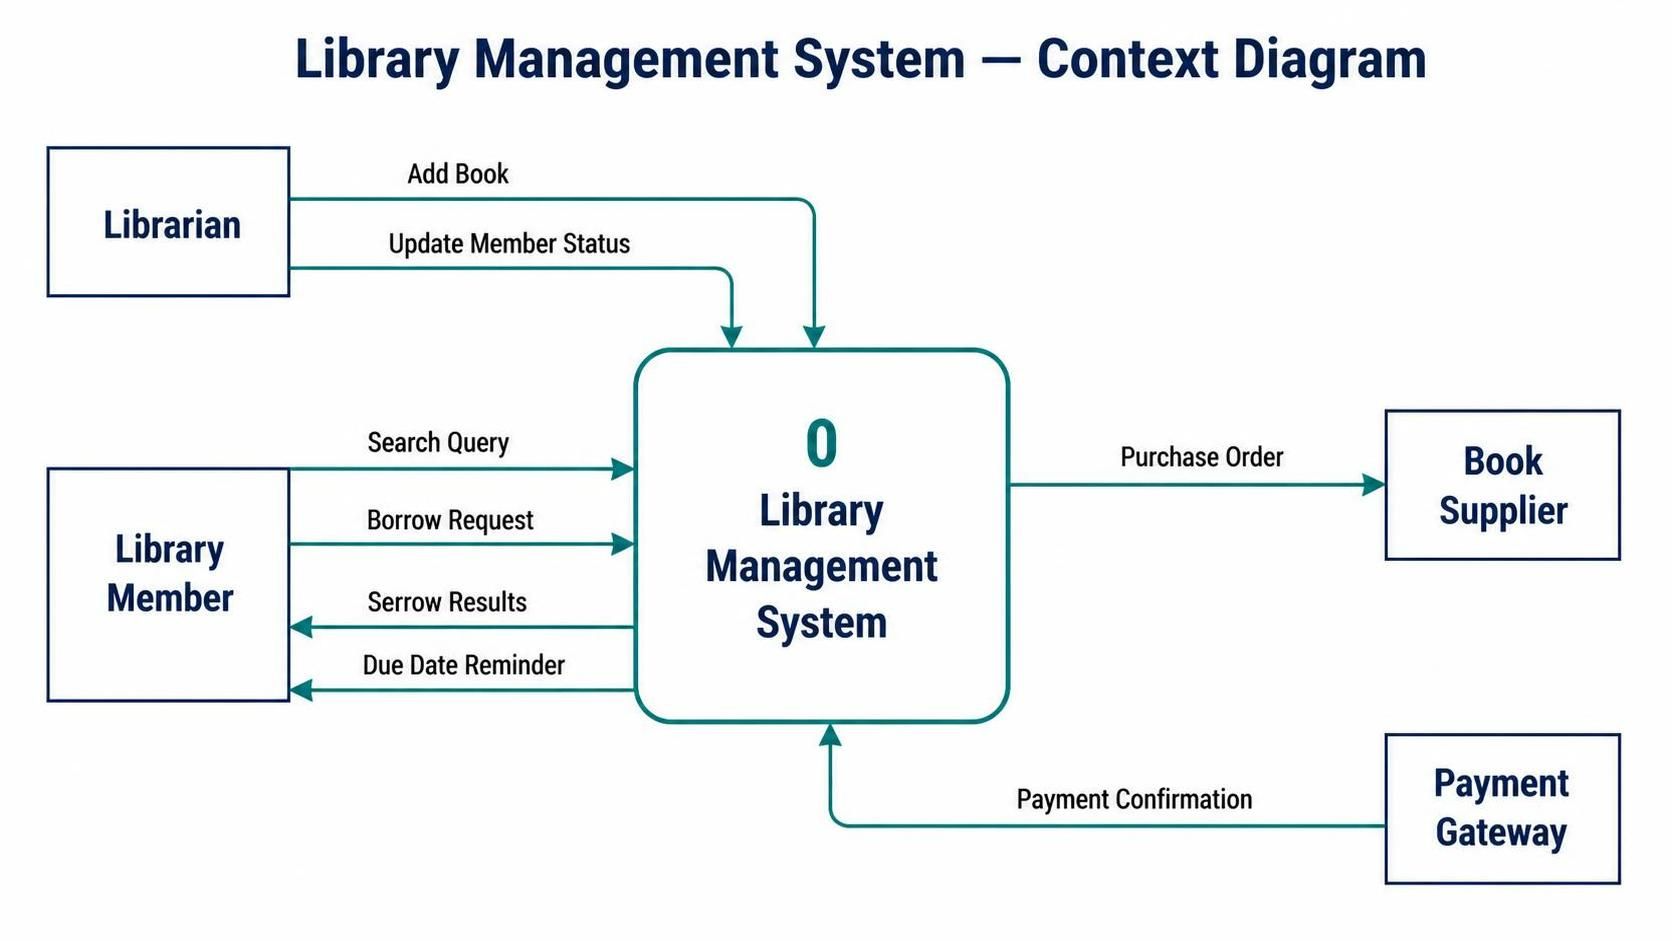
Example: For a library management system, external entities might include “Library Member,” “Book Supplier,” and “Payment Gateway.”
3. Data Store (Open-ended Rectangle or Parallel Lines)
Data stores represent where data is held persistently within the system. These could be databases, files, or any form of data retention. Importantly, data stores do not transform data—they simply hold it.
Example: “Customer Database,” “Inventory Records,” or “Transaction Log” would all be data stores in a retail system.
4. Data Flow (Labeled Arrow)
Data flows show the direction of data movement between processes, external entities, and data stores. Each arrow should be labeled with the specific data being transferred, making it clear what information is moving where.
Example: An arrow from “Customer” to “Place Order” might be labeled “Order Details,” while an arrow from “Place Order” to “Order Database” might be labeled “New Order Record.”
DFD Levels: From Overview to Detail
DFDs use a hierarchical decomposition approach, allowing you to start with a high-level view and drill down into increasing levels of detail.
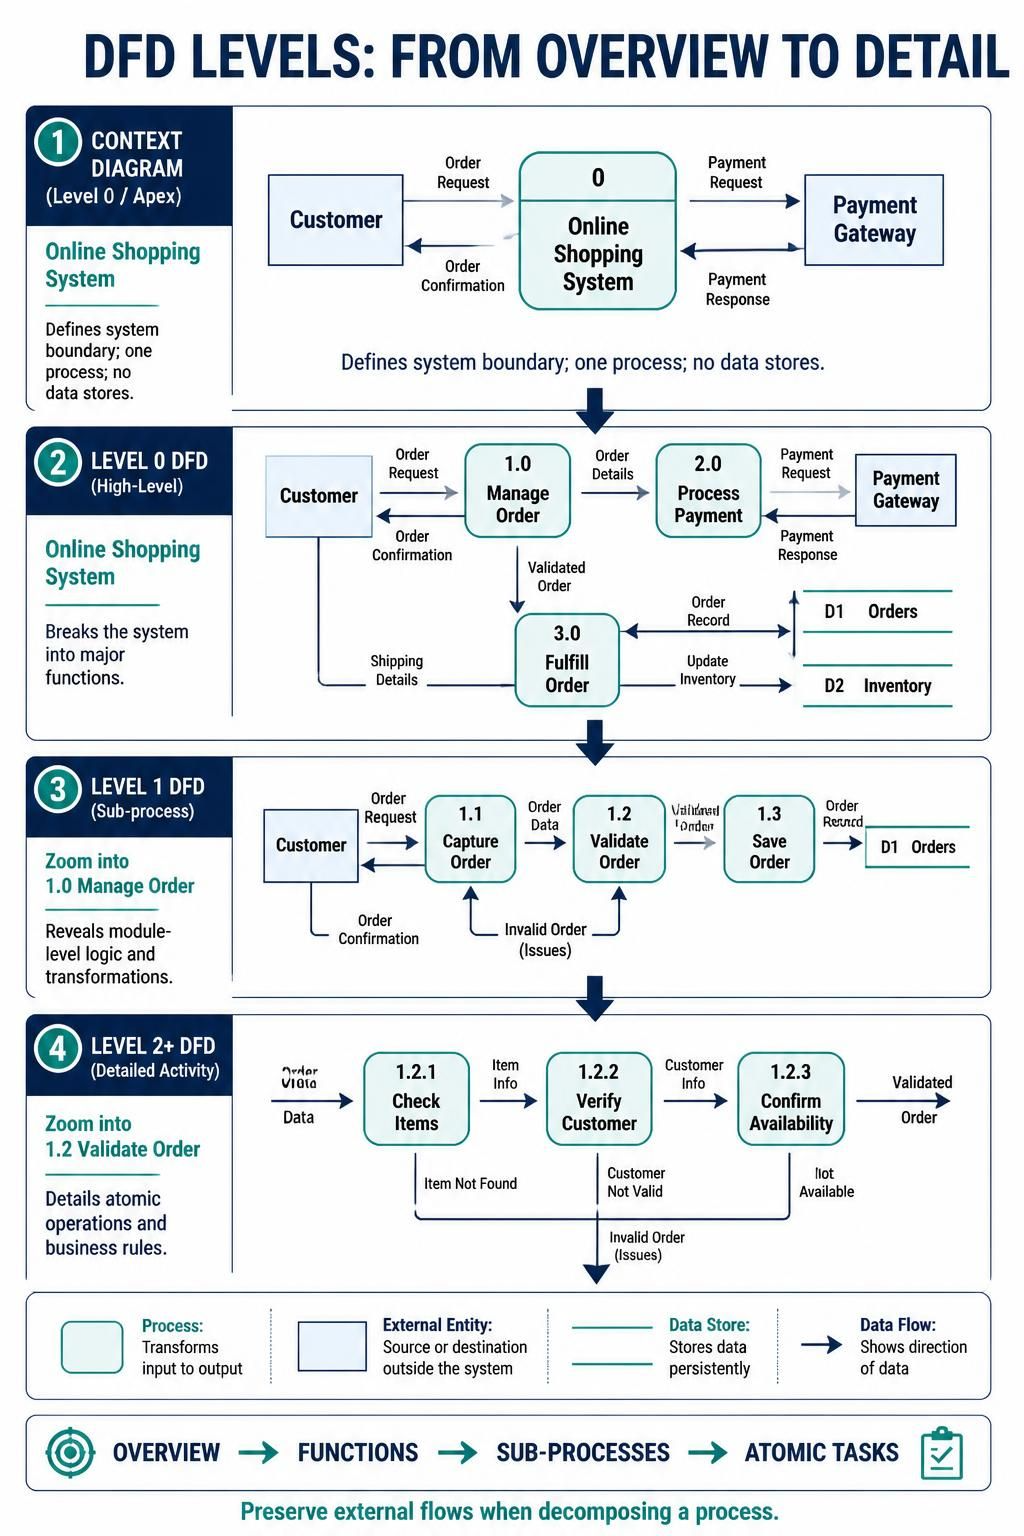
Context Diagram (Level 0/Apex)
The context diagram shows your entire system as a single process (Process 0) interacting with external entities. It defines the system boundary and shows what’s inside versus outside your scope. No data stores appear at this level.
Use Case: Presenting to executives or stakeholders who need to understand system boundaries without getting bogged down in internal details.
Level 0 DFD (High-Level)
This breaks down the single process from the context diagram into major functional areas (typically 3-7 processes numbered 1.0, 2.0, 3.0, etc.). Data stores are introduced at this level, and all external entities from the context diagram are preserved.
Use Case: Providing architects and senior developers with an overview of major system components and their interactions.
Level 1 DFD (Sub-process)
Each Level 0 process can be decomposed further into sub-processes (1.1, 1.2, 2.1, etc.), revealing more detailed business logic and data transformations.
Use Case: Guiding development teams in implementing specific modules or features.
Level 2+ DFD (Detailed Activity)
Further decomposition reveals granular tasks and specific business rules. You continue decomposing until each process represents a single, atomic operation that can be easily implemented.
Use Case: Supporting detailed design documentation and test case creation.
Critical DFD Rules
To maintain diagram integrity and usefulness, follow these essential rules:
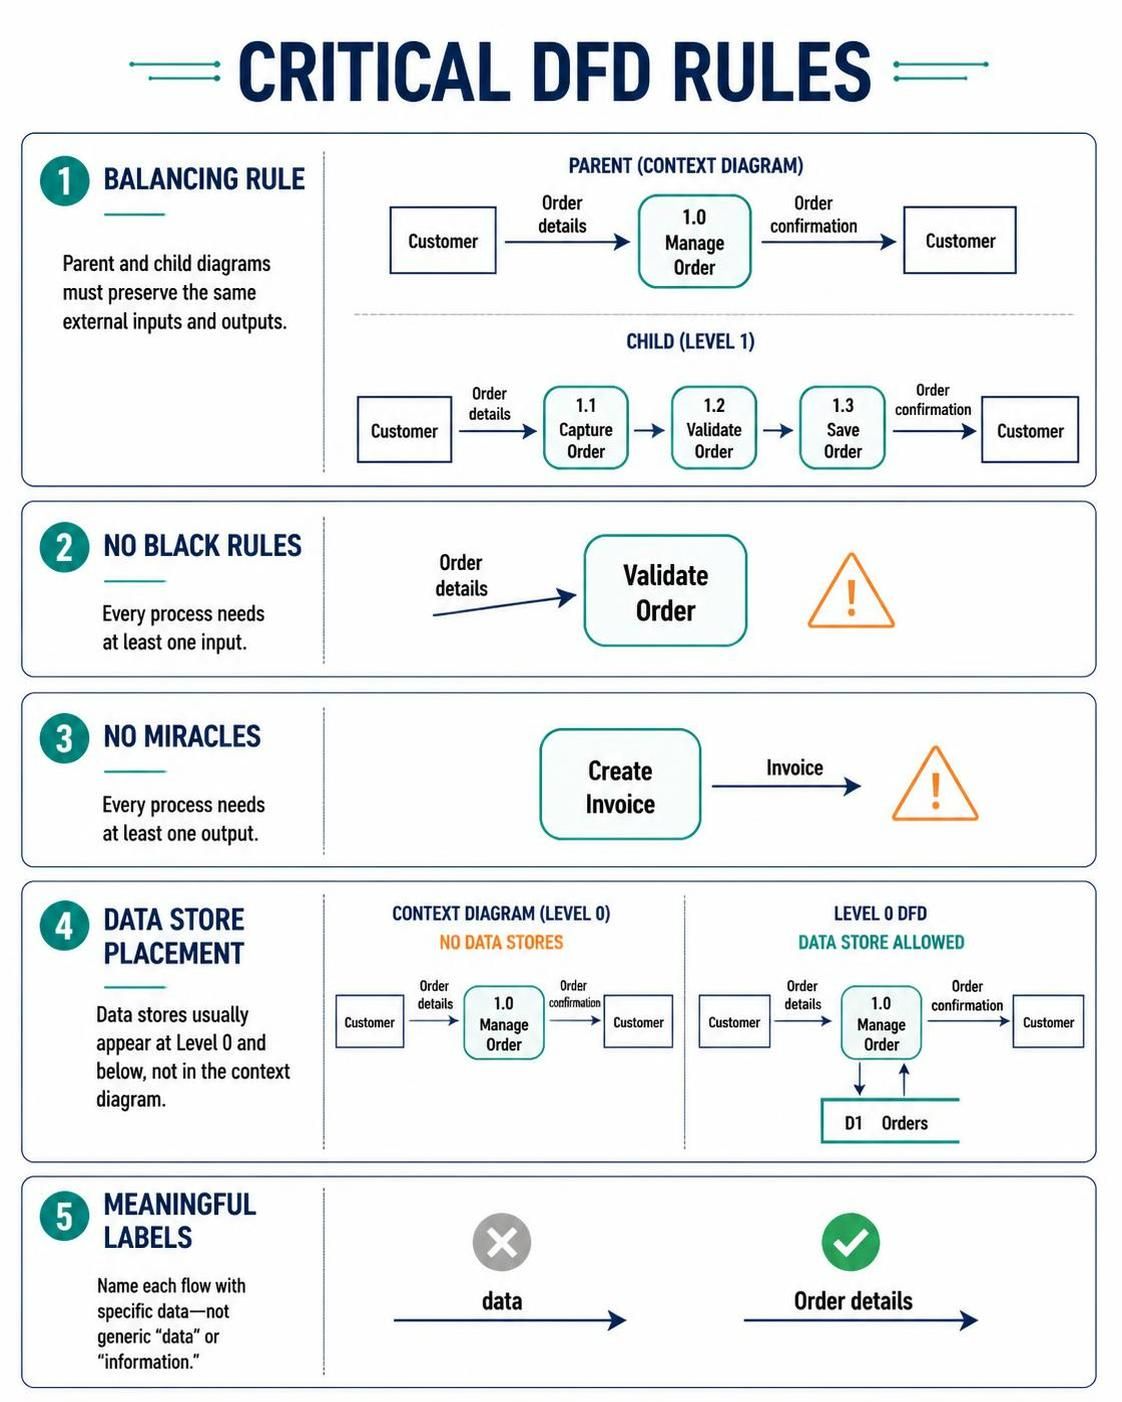
Balancing Rule: All data flows entering or leaving a parent process must match the total data flows entering or leaving its decomposed child processes. This ensures no data is lost or created mysteriously during decomposition.
No Black Holes: Every process must have at least one input. A process that receives no data cannot perform any transformation.
No Miracles: Every process must have at least one output. A process that produces no output serves no purpose.
Data Store Placement: Data stores typically appear at Level 0 and below. The context diagram usually excludes them to maintain focus on system boundaries.
Meaningful Labels: Every data flow should be labeled with specific data names, not generic terms like “data” or “information.”
Building DFDs in Visual Paradigm
Visual Paradigm provides an intuitive, feature-rich environment for creating professional DFDs with automated support for decomposition and navigation.
Step 1: Creating the Context Diagram
-
Start a New Diagram: Go to the top toolbar and select
Diagram > New. Choose “Data Flow Diagram” from the diagram type list and click Next. Name your diagram (e.g., “E-Commerce System – Context Diagram”) and click OK. -
Add the System Process: Drag a Process shape onto the canvas. This represents your entire system as Process 0. Give it a descriptive name like “Online Shopping System.”
-
Identify External Entities: Think about who or what interacts with your system from the outside. Drag External Entity shapes around the edges of your canvas. Common examples include “Customer,” “Administrator,” “Payment Processor,” and “Shipping Provider.”
-
Connect with Data Flows: Use the Data Flow tool to draw arrows between external entities and your system process. Label each arrow with the specific data being exchanged. For example, an arrow from “Customer” to “Online Shopping System” might be labeled “Browse Request” or “Purchase Order.”
-
Review System Boundary: Ensure your context diagram clearly shows what’s inside your system (the single process) versus what’s outside (all external entities). This establishes the scope for all subsequent diagrams.
Step 2: Decomposing to Level 0
-
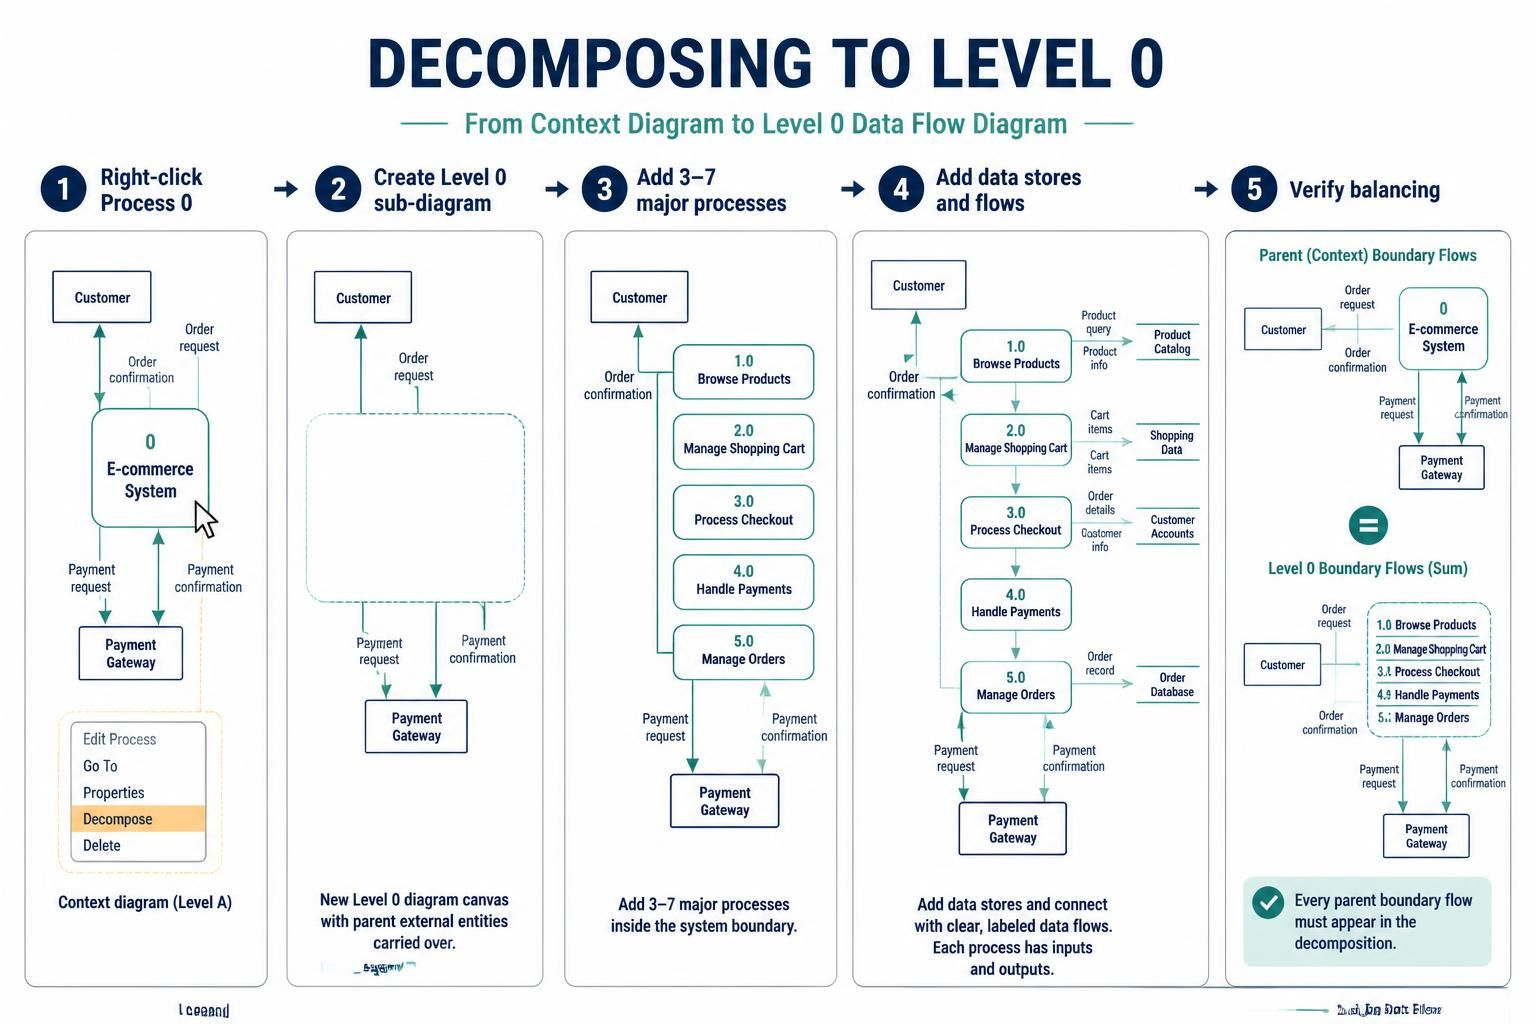
Right-click Process 0: On your context diagram, right-click the main process shape and select “Decompose” from the popup menu.
-
Automatic Sub-diagram Creation: Visual Paradigm will automatically create a new sub-diagram for Level 0. It carries over connected external entities and prepares the canvas for your major functional processes.
-
Add Major Processes: Identify 3-7 core functions of your system. For an e-commerce platform, these might be:
-
1.0 Browse Products
-
2.0 Manage Shopping Cart
-
3.0 Process Checkout
-
4.0 Handle Payments
-
5.0 Manage Orders
-
-
Introduce Data Stores: Add data stores that support these processes, such as “Product Catalog,” “Customer Accounts,” “Shopping Cart Data,” and “Order Database.”
-
Map Data Flows: Connect processes to each other, to external entities, and to data stores with appropriately labeled data flows. Ensure every process has inputs and outputs.
-
Verify Balancing: Check that all data flows entering or leaving Process 0 in the context diagram are accounted for in your Level 0 diagram. If the context diagram showed “Order Details” flowing into the system, your Level 0 should show this data entering one of your processes (likely 3.0 Process Checkout).
Step 3: Drilling Down to Level 1 and Beyond
-
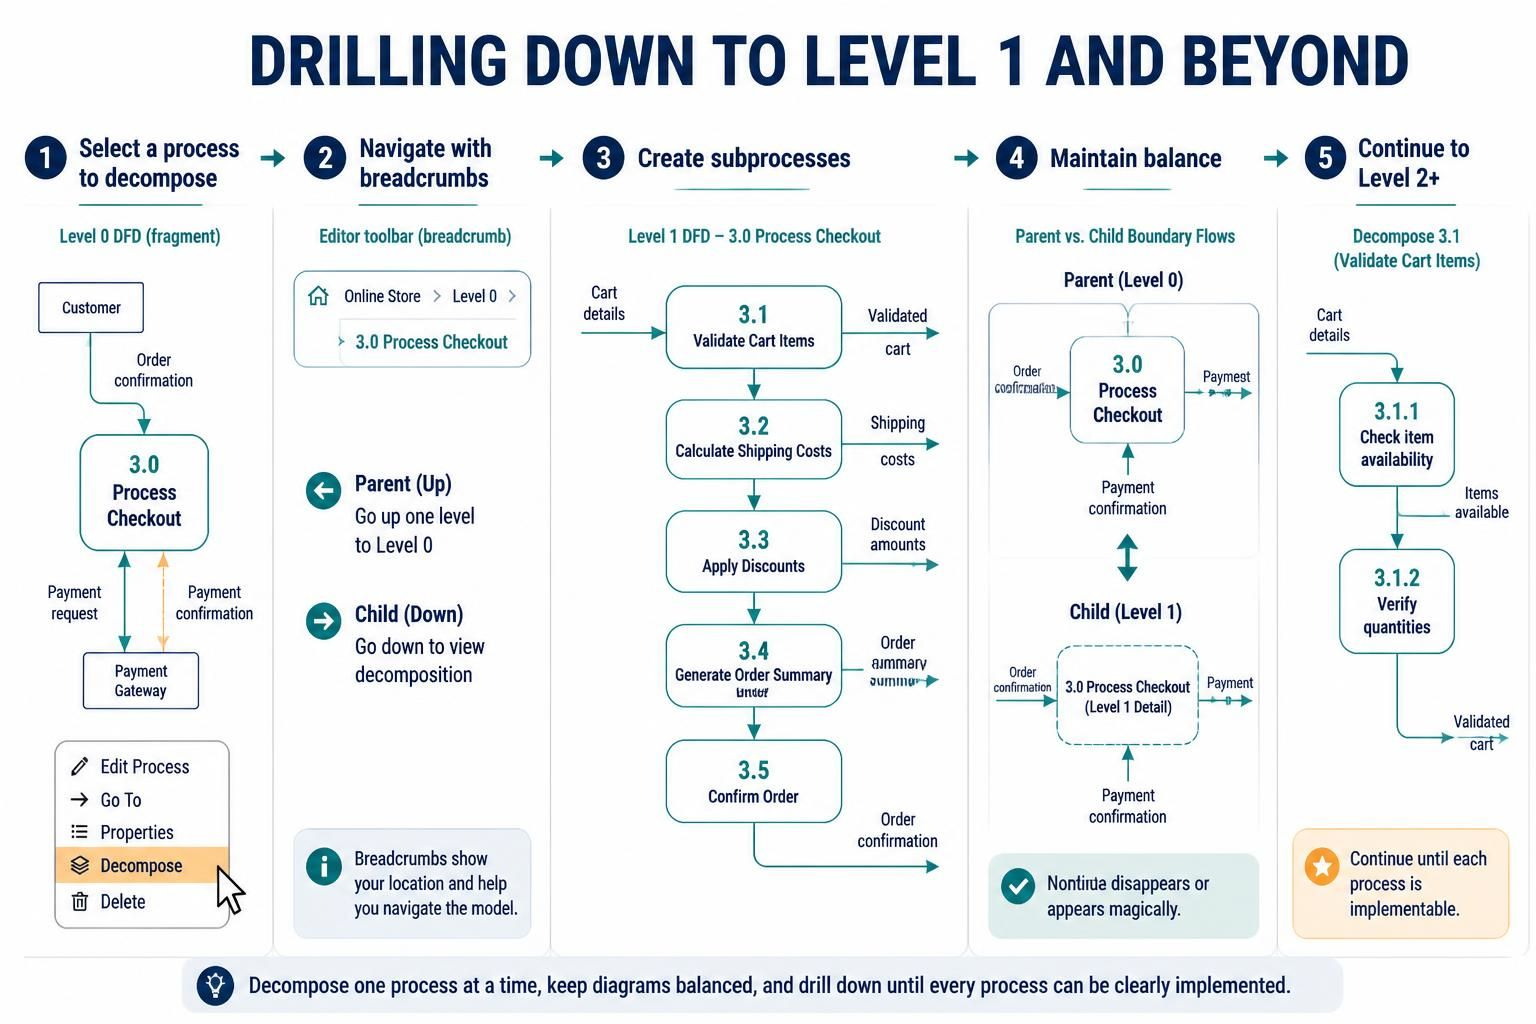
Select a Process to Decompose: Choose a Level 0 process that needs more detail. For example, right-click “3.0 Process Checkout” and select “Decompose.”
-
Navigate Using Breadcrumbs: Visual Paradigm creates breadcrumb navigation at the top of the editor, allowing you to easily switch between parent and child diagrams. Click breadcrumbs to move up or down the hierarchy.
-
Create Sub-processes: Break down the selected process into 3-7 sub-processes. For “Process Checkout,” you might create:
-
3.1 Validate Cart Items
-
3.2 Calculate Shipping Costs
-
3.3 Apply Discounts
-
3.4 Generate Order Summary
-
3.5 Confirm Order
-
-
Maintain Balance: Ensure all data flows entering or leaving the parent process (3.0) are distributed among the child processes (3.1-3.5). No data should disappear or appear magically.
-
Continue Decomposition: Repeat this process for any sub-processes that remain too complex, creating Level 2 diagrams (3.1.1, 3.1.2, etc.) until each process represents a single, implementable operation.
Step 4: Best Practices for Professional DFDs
Consistent Naming Conventions: Use verb-noun pairs for processes (e.g., “Validate Payment”), singular nouns for data stores (e.g., “Customer Record”), and specific data names for flows (e.g., “Credit Card Number”).
Logical Grouping: Arrange related processes close together on the canvas. Use consistent spacing and alignment to improve readability.
Minimize Crossing Lines: Rearrange shapes to minimize crossing data flow arrows. When crossings are unavoidable, use jump-over symbols if available in your tool.
Document Assumptions: Add notes or annotations to clarify any assumptions or special cases that aren’t obvious from the diagram itself.
Version Control: Save different versions of your diagrams as you iterate. Visual Paradigm supports project management features that help track changes.
Practical Example: Online Library Management System
Let’s apply these concepts to model a simplified online library management system.
Context Diagram
-
System Process: “Library Management System”
-
External Entities: “Library Member,” “Librarian,” “Book Supplier,” “Payment Gateway”
-
Key Data Flows:
-
Member → System: “Search Query,” “Borrow Request”
-
System → Member: “Search Results,” “Due Date Reminder”
-
Librarian → System: “Add Book,” “Update Member Status”
-
System → Book Supplier: “Purchase Order”
-
Payment Gateway → System: “Payment Confirmation”
-
Level 0 DFD
-
Processes:
-
1.0 Search Catalog
-
2.0 Manage Borrowing
-
3.0 Process Returns
-
4.0 Manage Inventory
-
5.0 Handle Membership
-
-
Data Stores:
-
Book Catalog
-
Member Records
-
Borrowing History
-
Inventory Log
-
-
Sample Data Flows:
-
“Search Query” flows from Library Member to 1.0 Search Catalog
-
“Search Results” flows from 1.0 Search Catalog to Library Member
-
“Book Details” flows from Book Catalog to 1.0 Search Catalog
-
“Borrow Request” flows from Library Member to 2.0 Manage Borrowing
-
“Updated Availability” flows from 2.0 Manage Borrowing to Book Catalog
-
Level 1 DFD (Decomposing 2.0 Manage Borrowing)
-
Sub-processes:
-
2.1 Check Member Eligibility
-
2.2 Verify Book Availability
-
2.3 Create Borrowing Record
-
2.4 Update Book Status
-
2.5 Send Confirmation
-
-
Balancing Check:
-
Input to 2.0: “Borrow Request” (from Member), “Book Info” (from Book Catalog), “Member Info” (from Member Records)
-
Outputs from 2.0: “Confirmation” (to Member), “Updated Status” (to Book Catalog), “New Record” (to Borrowing History)
-
These must all be accounted for in the sub-processes 2.1-2.5
-
Common Mistakes to Avoid
1. Confusing DFDs with Flowcharts: Remember that DFDs show data movement, not control flow. Don’t include decision diamonds or loops—those belong in flowcharts or activity diagrams.
2. Over-decomposing Too Early: Start with the context diagram and Level 0 before diving into details. Premature decomposition can lead to unbalanced diagrams and confusion.
3. Ignoring the Balancing Rule: Always verify that data flows are preserved during decomposition. Unbalanced diagrams indicate missing requirements or logical errors.
4. Vague Data Flow Labels: Labels like “Data” or “Info” provide no value. Be specific: “Customer Address,” “Product Price,” “Order ID.”
5. Including Control Information: DFDs should not show timing, sequencing, or conditional logic. Focus purely on what data moves where, not when or under what conditions.
6. Forgetting External Entities: Every data flow must originate from or terminate at a process, data store, or external entity. Data flows cannot connect directly to other data flows.
Conclusion
Data Flow Diagrams remain one of the most effective tools for understanding and communicating how information moves through a system. By focusing on data rather than control flow, DFDs provide clarity that benefits both technical and non-technical stakeholders. The hierarchical decomposition approach allows you to start with a bird’s-eye view and progressively reveal details only where needed, keeping diagrams manageable and focused.
Visual Paradigm streamlines the DFD creation process with automated decomposition, breadcrumb navigation, and balancing assistance, making it easier to maintain consistency across multiple diagram levels. By following the core principles outlined in this guide—proper notation usage, strict adherence to balancing rules, and systematic decomposition—you can create DFDs that serve as reliable blueprints for system development.
Whether you’re documenting an existing system for improvement or designing a new solution from scratch, mastering DFDs will enhance your ability to analyze requirements, identify gaps, and communicate effectively with your team. Start with a simple context diagram, validate your understanding with stakeholders, and gradually build out the details. With practice, you’ll find that DFDs become an indispensable part of your systems analysis toolkit.
Reference
-
Mastering Data Flow Diagrams with Visual Paradigm: A Step-by-Step Guide: A step-by-step guide covering how to access DFD templates, identify external entities, define processes, specify data stores, and connect data flows .
-
The Complete Guide to Drawing Effective Data Flow Diagrams: Explains DFD symbol conventions, the three levels (Context/Level 1/Level 2), the balancing rule, and naming conventions, suitable for building standardized DFDs .
-
How to Draw Data Flow Diagram? (Visual Paradigm User Guide): Official user guide on creating DFDs and process decomposition, covering the meanings of notations such as Process, External Entity, Data Store, and Data Flow .
-
How to Create DFD with Visual Paradigm Desktop: Demonstrates the complete workflow from context diagrams to lower-level diagrams, including decomposition, balance checking, and export options .
-
DFD Tutorial: Yourdon Notation: Introduces the differences between DFD and flowchart, Yourdon/Gane & Sarson notations, and the top-down decomposition numbering method .
-
Comprehensive Guide to BPMN, Visual Paradigm Tooling, AI and Ecosystem: (Vietnamese) Explains how AI generates editable BPMN 2.0 models through NLP from text descriptions, and mentions that Visual Paradigm’s AI ecosystem supports modeling of DFD and other diagram types .
-
How AI is Transforming Business Process Modeling: (French) Discusses the transformation from manual diagramming to AI-assisted BPM, including how Visual Paradigm’s AI assistant generates structured models through natural language conversation, and supports iterative refinement .


Comments (0)