From Chaos to Clarity: Using the C4 Model to Structure Enterprise Systems
Enterprise architecture often resembles a tangled web. 🕸️ As systems grow, the gap between business goals and technical implementation widens. Documentation becomes outdated, diagrams are hard to read, and new team members struggle to grasp the landscape. This is where structure matters. The C4 Model offers a pragmatic approach to software architecture documentation, focusing on the most important abstractions rather than getting lost in the weeds.
This guide explores how to apply the C4 Model to bring order to complex environments. We will examine each level of abstraction, discuss practical implementation strategies, and highlight how this method improves communication without enforcing rigid tooling. By the end, you will understand how to create living documentation that serves your team and system effectively. 🛠️
The Challenge of Modern System Complexity 📉
Before diving into the solution, it is necessary to acknowledge the problem. Enterprise systems are rarely monolithic anymore. They consist of microservices, APIs, third-party integrations, and legacy components. Traditional documentation methods often fail here.
Consider the common issues teams face:
- Over-Engineering Diagrams: Attempting to draw every class and method creates noise. These diagrams become unreadable within days of a code change.
- Lack of Context: Technical teams focus on internals, while business stakeholders need to understand how data flows between systems.
- Stale Documentation: Static PDFs or Word documents are rarely updated. They become a source of misinformation.
- Tool Dependency: Teams spend more time configuring drawing tools than understanding the architecture itself.
The goal is not to produce perfect art. The goal is to facilitate understanding. The C4 Model addresses this by defining a hierarchy of diagrams, each serving a specific audience and purpose. This hierarchy allows you to zoom in and out as needed, maintaining clarity at every level.
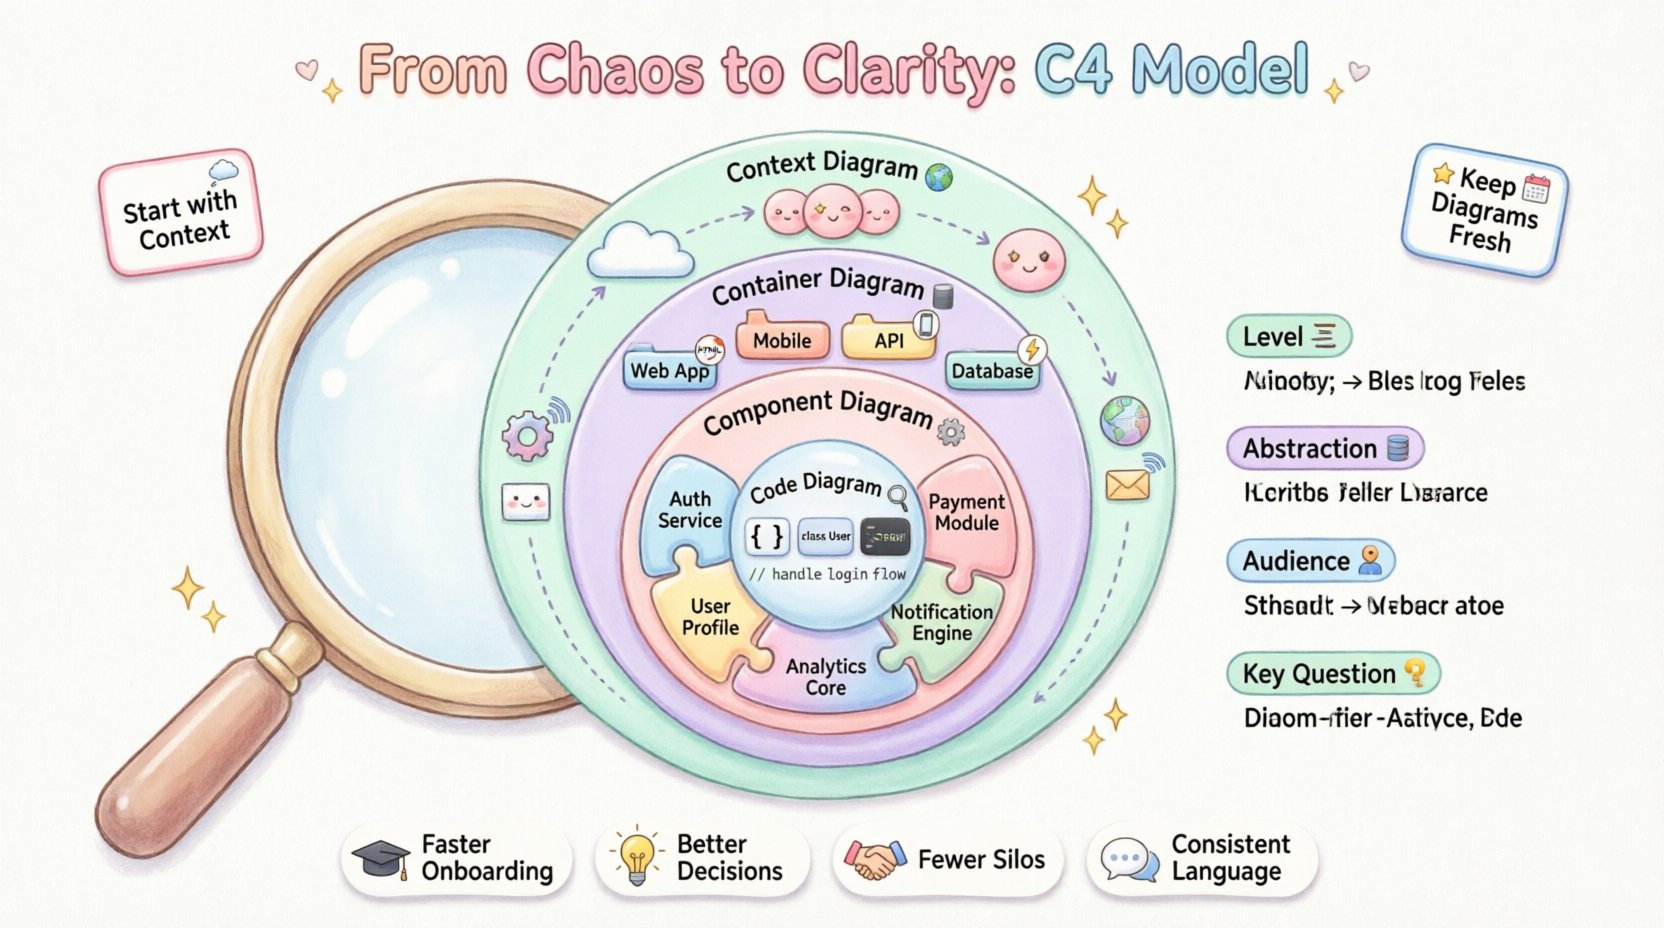
Understanding the C4 Model Levels 📊
The C4 Model is built on four distinct levels. Each level represents a different degree of abstraction. Moving from Level 1 to Level 4 involves zooming in on the details. This structure prevents information overload.
Here is the breakdown of the hierarchy:
- Level 1: Context Diagrams – The big picture. Shows the system and its users.
- Level 2: Container Diagrams – The technology boundaries. Shows servers, databases, and applications.
- Level 3: Component Diagrams – The logical structure. Shows modules within a container.
- Level 4: Code Diagrams – The implementation details. Shows classes and interfaces.
Not every system requires all four levels. Many enterprise applications function well with just the first three. Level 4 is often optional and typically reserved for complex algorithms or performance-critical sections.
Level 1: System Context Diagram 🌍
The Context Diagram is your starting point. It answers the question: What is this system, and who uses it? This diagram exists at a high level of abstraction. It does not show internal logic. It focuses on interactions.
Key Elements to Include:
- The System: Represented as a central box. Give it a clear name and a brief description.
- People: Users, administrators, or external roles interacting with the system.
- Other Systems: External services, databases, or legacy applications that communicate with your system.
- Relationships: Arrows showing data flow or communication paths.
When creating a Context Diagram, avoid internal details. Do not list internal components. Do not specify technologies. The audience for this diagram includes product managers, stakeholders, and new developers. It sets the boundary of the project.
Example Scenario: A payment processing system might show a Customer, a Merchant, and an External Bank. The arrows indicate that the Customer initiates a transaction, the Merchant receives a confirmation, and the Bank processes the funds. This is all that is needed to understand the scope.
Level 2: Container Diagram 📦
Once the context is clear, we zoom in. The Container Diagram breaks down the single system box from Level 1 into individual containers. A container is a high-level grouping of code and data that can be deployed independently. It is a physical runtime environment.
Common Container Types:
- Web Applications (e.g., React, Angular)
- Mobile Applications (e.g., iOS, Android)
- APIs (e.g., REST, GraphQL)
- Database Systems (e.g., SQL, NoSQL)
- Background Jobs / Batch Processes
- Microservices
What to Document:
- Technology Stack: Clearly state the language and framework (e.g., Node.js, Python, Java).
- Purpose: Why does this container exist? What business value does it provide?
- Connections: How do containers talk to each other? Use protocols like HTTP, TCP, or message queues.
This level is crucial for architects and senior developers. It helps identify where data resides and how the system is physically structured. It highlights dependencies between different parts of the infrastructure.
Level 3: Component Diagram ⚙️
Inside a container, things get more detailed. The Component Diagram shows the logical building blocks within a single container. Unlike containers, components are not deployed independently. They are parts of the codebase that work together.
Component Characteristics:
- They have a specific responsibility or function.
- They interact with other components via interfaces or APIs.
- They are often loosely coupled.
When to Use Level 3:
- Explaining complex business logic.
- Onboarding developers to a specific service.
- Designing new features within an existing module.
A component diagram should not show every single class. It should group related classes into functional units. For example, an authentication service might have components for Token Generation, Validation, and User Lookup.
This level bridges the gap between high-level architecture and actual code. It helps teams understand where to place new code and how to maintain boundaries.
Level 4: Code Diagram 🔍
Level 4 is the deepest level. It maps directly to the codebase. It shows classes, interfaces, and methods. This is rarely necessary for general documentation and is often generated automatically from the code.
Use Cases for Level 4:
- Performance tuning.
- Security analysis.
- Explaining complex algorithms.
- Legacy system refactoring.
Because this level changes frequently with every commit, it is best to generate it automatically. Manual maintenance of Level 4 diagrams is usually not sustainable. It serves as a reference for specific implementation details rather than overall system understanding.
Comparing the Levels 📋
To visualize the differences, refer to the table below. This helps in selecting the right diagram for the right audience.
| Level | Abstraction | Primary Audience | Key Question Answered |
|---|---|---|---|
| Context | System & Users | Stakeholders, PMs | What is the system? |
| Container | Technology Boundaries | Architects, DevOps | How is it built? |
| Component | Logical Structure | Developers, Team Leads | How does it work? |
| Code | Implementation Details | Engineers, Specialists | What is the logic? |
Implementation Strategy 🚀
Adopting the C4 Model requires a shift in mindset. It is not about drawing pretty pictures. It is about managing information. Here is a practical approach to integrating this model into your workflow.
1. Start with the Context
Before touching any code or containers, define the boundaries. Gather the team and agree on who the users are and what external systems matter. This prevents scope creep later on. A clear Context Diagram acts as a contract for the project scope.
2. Keep it Tool Agnostic
Do not get tied to a specific drawing tool. The model is independent of the software used to create it. You can use text-based definitions, diagramming tools, or even code-as-documentation. The content matters more than the rendering engine.
3. Focus on Communication
Share these diagrams in design reviews, onboarding sessions, and architectural decision records. They are conversation starters, not final documents. Encourage questions. If a diagram confuses someone, simplify it rather than adding more detail.
4. Version Control Your Diagrams
Treat architecture documentation like code. Store diagrams in your repository. This ensures they evolve alongside the system. Automated pipelines can verify that diagrams exist and are up to date when code changes occur.
Common Pitfalls to Avoid ⚠️
Even with a solid model, teams often make mistakes. Awareness of these traps helps maintain clarity over time.
- Over-Documenting: Trying to document every edge case leads to paralysis. Focus on the happy path and critical flows first.
- Skipping Levels: Jumping from Context directly to Code creates a massive gap in understanding. Use the middle levels to bridge the knowledge.
- Ignoring Updates: A diagram that is one year old is worse than no diagram. It gives false confidence. Establish a review cadence.
- Using for Everything: Do not use the C4 Model for UI wireframes or database schema designs unless they fit the abstraction levels.
Benefits for Enterprise Teams 🤝
Why invest the time? The returns are significant when scaling across multiple teams.
Improved Onboarding: New hires can grasp the system landscape in hours rather than weeks. They can navigate from high-level context down to specific components without getting lost.
Better Decision Making: When considering a new technology or a refactor, the diagrams provide the necessary context to understand impact. You can see where the data flows and where the dependencies lie.
Reduced Silos: Different teams can own different containers or components. The diagrams make the boundaries clear, allowing teams to work independently while understanding how they fit together.
Language Consistency: The C4 Model provides a shared vocabulary. Instead of arguing about terms, teams can refer to levels and elements consistently. This reduces ambiguity in meetings.
Maintaining Relevance Over Time 🔁
The biggest challenge is keeping documentation fresh. Architecture drifts as the system grows. Here is how to manage that lifecycle.
- Assign Ownership: Designate a team member or group responsible for updating specific diagrams. This prevents the “everyone owns it, so no one owns it” problem.
- Link to Code: Where possible, link diagram elements to the actual repository or code paths. This helps verify accuracy.
- Automate Where Possible: Use tools to generate Level 4 diagrams from code. This ensures the lowest level is always accurate.
- Regular Audits: Schedule quarterly reviews of the high-level diagrams. Ask: Does this still reflect reality? Is anything missing?
Integrating with Agile Workflows 🔄
Agile methodologies emphasize iteration. The C4 Model supports this by allowing incremental updates. You do not need to draw the entire system before starting work.
Sprint Planning: Update the Component Diagram when a new feature is being designed. This ensures the feature fits the existing architecture.
Refactoring: If a module is being restructured, update the diagram first. This serves as a plan for the refactoring effort.
Incident Response: During an outage, the Context and Container diagrams help quickly identify which services are involved. This speeds up the debugging process.
Final Thoughts on Structural Clarity 🎯
Building enterprise systems is difficult enough without adding documentation overhead. The C4 Model reduces that overhead by providing a focused framework. It strips away the unnecessary and highlights the essential.
By adhering to the levels of abstraction, teams can communicate effectively without getting bogged down in implementation details. It is a tool for thinking, not just for drawing. When used correctly, it transforms chaos into a structured, understandable environment.
Start small. Draw a Context Diagram for your current project. See how it helps your team talk about the system. Then, expand to Containers and Components as the need arises. The goal is clarity, not perfection. With the right structure, complex systems become manageable. 🌟


Comments (0)