Tags:
Five Forces Model: A Visual Guide for Beginners
Understanding the competitive landscape is essential for any business aiming for long-term viability. The Five Forces Model provides a structured way to analyze industry dynamics. This framework helps organizations identify where power lies within a market. It highlights the factors that influence profitability. By examining these forces, companies can make informed strategic decisions. This guide breaks down the model into digestible components. We will explore each force in detail. We will also discuss how to apply the analysis to real-world scenarios.
🏛️ Origins of the Framework
Michael Porter introduced this model in his 1979 Harvard Business Review article. He sought to explain why some industries are inherently more profitable than others. Porter observed that competition extends beyond direct rivals. It includes the pressure from other directions in the market. The model focuses on the industry structure rather than the specific products. This structural view reveals the underlying economic forces. These forces determine the profit potential. Understanding the origin helps contextualize the analysis.
- Year of Publication: 1979
- Author: Michael E. Porter
- Core Concept: Industry structure determines profitability
- Primary Use: Strategic planning and competitive analysis
The framework remains relevant decades later. Modern markets may evolve, but the fundamental dynamics persist. Digital transformation has changed some barriers, yet the core logic holds. This guide uses a visual approach to simplify the concepts. You will see how each force interacts with the others.
🔍 Understanding the Five Forces
The model consists of five distinct forces. Each force represents a source of competitive pressure. Together, they shape the intensity of competition. This intensity dictates the overall profit margin. A strong force implies lower profitability. A weak force suggests higher potential for returns. Let us examine each force individually.
1. Threat of New Entrants 🚪
New competitors entering the market can erode existing profitability. They bring new capacity and a desire to gain market share. Established firms often react by lowering prices. This reaction hurts the margins of everyone involved. The threat depends on how easy it is to enter the industry.
Barriers to entry play a critical role here. High barriers protect incumbents. Low barriers invite disruption. Consider the following factors:
- Capital Requirements: How much money is needed to start?
- Regulations: Are there legal hurdles or licenses?
- Switching Costs: Can customers easily move to a new provider?
- Access to Distribution: Is it hard to reach the customer?
- Government Policy: Do laws favor existing players?
If capital requirements are low, the threat is high. If switching costs are high, the threat is low. This force assesses the stability of the current market players.
2. Bargaining Power of Suppliers ⚖️
Suppliers provide the inputs necessary for production. If they have significant power, they can raise prices. This action reduces the profitability of the industry. The power of suppliers depends on their ability to dictate terms.
Consider these indicators of supplier power:
- Number of Suppliers: Fewer suppliers mean more power.
- Uniqueness of Product: Are inputs differentiated or commoditized?
- Switching Costs: How expensive is it to change suppliers?
- Threat of Forward Integration: Can suppliers become competitors?
- Criticality of Input: How essential is the supply to the business?
When a company relies on a single source, supplier power is high. When many alternatives exist, power is low. This force directly impacts cost structures and pricing strategies.
3. Bargaining Power of Buyers 💰
Customers dictate the price they are willing to pay. If they have high power, they can demand lower prices. They can also demand higher quality or more service. This pressure squeezes industry profits. The power of buyers varies by market segment.
Key factors influencing buyer power include:
- Concentration of Buyers: Are there few large buyers or many small ones?
- Volume of Purchase: Do buyers purchase in large quantities?
- Price Sensitivity: Does price drive the buying decision?
- Switching Costs: Is it easy to find an alternative?
- Information Availability: Do buyers know the true cost?
In B2B markets, large corporate buyers often hold significant leverage. In B2C markets, power is often diluted among many consumers. Understanding this dynamic helps in pricing and customer retention strategies.
4. Threat of Substitute Products 🔄
Substitutes are products from outside the industry. They fulfill the same need but in a different way. A high threat limits the price a company can charge. If a substitute is cheaper or better, customers will switch.
Examples of substitution include:
- Technological Innovation: Streaming replacing physical media.
- Price/Performance Ratio: Is the substitute more efficient?
- Buyer Propensity: Are customers open to changing habits?
- Availability: Can the substitute be easily found?
Industries facing high substitution risks must innovate continuously. They must ensure their value proposition remains superior. Otherwise, market share will erode to the substitute sector.
5. Rivalry Among Existing Competitors ⚔️
This is the most visible force. It refers to the competition between current firms. Rivalry can take many forms: price wars, advertising battles, new product launches. Intense rivalry drives down prices and increases costs.
Factors that intensify rivalry include:
- Number of Competitors: More players usually mean more competition.
- Industry Growth: Slow growth leads to fighting for share.
- Fixed Costs: High fixed costs encourage price cutting.
- Differentiation: Lack of product uniqueness fuels price wars.
- Exit Barriers: Is it hard to leave the industry?
When exit barriers are high, companies stay in the market even when unprofitable. This creates overcapacity and aggressive competition. Managing rivalry requires differentiation and operational efficiency.
📋 Conducting the Analysis
Applying the model requires a systematic approach. You cannot simply guess the intensity of each force. Data collection and observation are necessary. Follow these steps to perform a thorough analysis.
- Define the Industry: Be specific about the market scope. What products are included? What geographic region?
- Gather Data: Collect information on competitors, suppliers, and customers.
- Evaluate Each Force: Score the intensity of each force.
- Identify Trends: Look for changes over time. Is the threat increasing or decreasing?
- Formulate Strategy: Use insights to guide decisions.
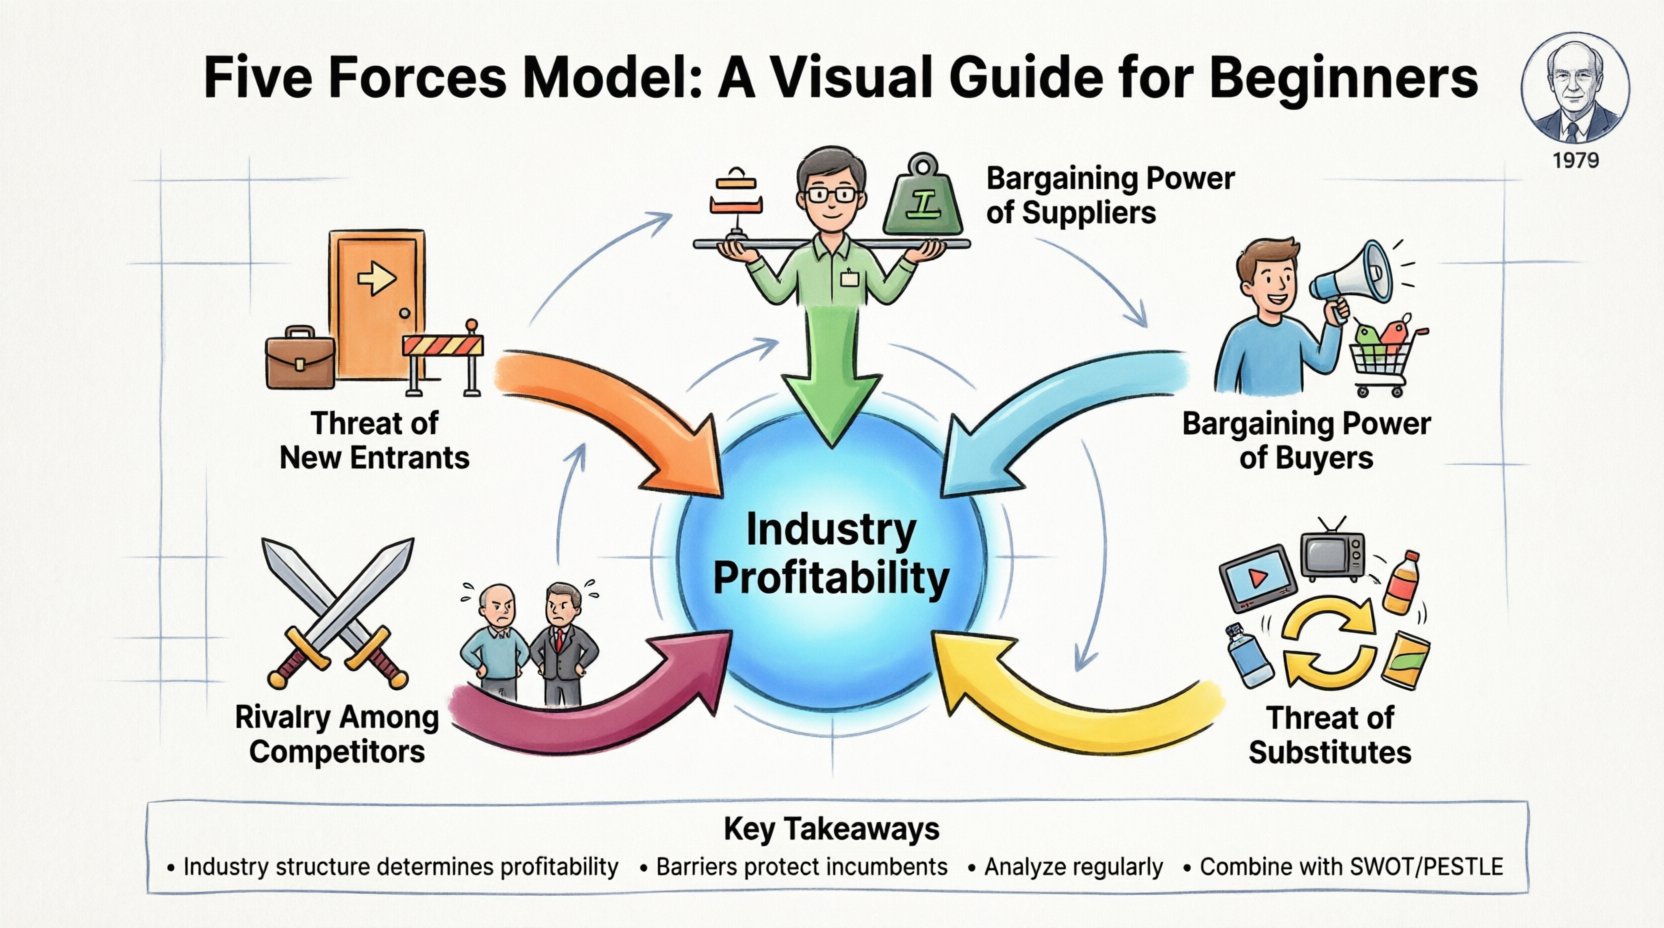
A visual representation often helps. A diagram can show the relationships between forces. The center of the model is the industry profitability. The forces surround it, pushing against it.
📊 Force Intensity Comparison
| Force | High Intensity Indicators | Low Intensity Indicators |
|---|---|---|
| New Entrants | Low capital needs, low switching costs | High regulations, strong brand loyalty |
| Suppliers | Few suppliers, unique inputs | Many suppliers, commoditized inputs |
| Buyers | Large volume, high price sensitivity | Fragmented buyers, low price sensitivity |
| Substitutes | Cheaper alternatives, high innovation | Unique value, high switching costs |
| Rivalry | Many competitors, slow industry growth | Few competitors, high industry growth |
This table serves as a quick reference. Use it to assess the current state of your market. It highlights where the pressure points are located.
🧩 Case Study: The Streaming Industry 🎬
Consider the digital streaming sector. It offers a clear example of how these forces interact. The industry has seen rapid growth in recent years. However, the dynamics are shifting.
- New Entrants: High. Tech giants can enter easily with capital.
- Suppliers: High. Content creators hold leverage over platforms.
- Buyers: High. Low switching costs between apps.
- Substitutes: Medium. Traditional TV and gaming compete for time.
- Rivalry: Very High. Price wars and content arms races.
This analysis explains why margins are often tight. Companies must invest heavily in content to retain users. The threat of churn is constant. Understanding these dynamics explains the strategic moves of major players.
⚠️ Limitations to Consider
While powerful, the model has boundaries. It is a static tool. It captures a snapshot in time. Markets are dynamic. Forces change rapidly. Relying solely on this model can lead to outdated strategies.
- Static Nature: It does not account for rapid change.
- Industry Focus: It ignores internal company capabilities.
- Interdependence: Forces interact in complex ways.
- Complementors: The model originally ignored partners.
Modern adaptations sometimes add a sixth force. This is the role of complementors. These are products that enhance the value of the main product. For example, app developers complement smartphone manufacturers. Acknowledging this addition can provide a more complete picture.
🔗 Linking to Other Strategies
The Five Forces Model is rarely used in isolation. It pairs well with other strategic tools. Combining frameworks yields deeper insights.
- SWOT Analysis: Use the forces to identify Threats and Opportunities.
- Value Chain: Align internal activities with external pressures.
- Blue Ocean Strategy: Use the analysis to find uncontested market space.
- PESTLE: Analyze macro-environmental factors affecting the forces.
This integration ensures a holistic view. It connects external market realities with internal execution. Strategy becomes a cohesive plan rather than a fragmented set of tactics.
📝 Final Considerations
Strategic planning is an ongoing process. The analysis should be revisited regularly. Market conditions shift. New technologies emerge. Competitors adapt. What was true last year may not hold today.
Commitment to continuous monitoring is key. Use the Five Forces as a compass. It points toward where the risks and rewards lie. It helps leaders navigate uncertainty. By understanding the structure of the industry, you can position your organization for success.
Start by mapping your specific industry. Identify the strongest pressures. Develop tactics to mitigate the risks. Leverage the areas of weakness in competitors. The goal is sustainable advantage. This requires discipline and clear thinking.
🌟 Key Takeaways
- The model analyzes five specific competitive pressures.
- Profitability is determined by industry structure.
- Barriers to entry protect incumbent profits.
- Supplier and buyer power dictate pricing limits.
- Rivalry intensity affects cost and margin.
- Regular updates are necessary for accuracy.
- Combine with other tools for a full strategy.
Apply this framework to your business context. The insights gained will inform resource allocation. They will guide investment decisions. They will shape product development. Use this knowledge to build a resilient organization. The path to growth is clearer when you understand the terrain.


Comments (0)