C4 Model and Security: Embedding Security Thinking in Architecture Diagrams
Software architecture diagrams serve as the primary communication tool for technical teams. They bridge the gap between abstract requirements and concrete implementation. However, a standard architecture diagram often focuses solely on functionality and data flow. It frequently overlooks the critical layer of security controls, trust boundaries, and threat mitigation strategies. When security is treated as an afterthought during the design phase, vulnerabilities are baked into the system before a single line of code is written.
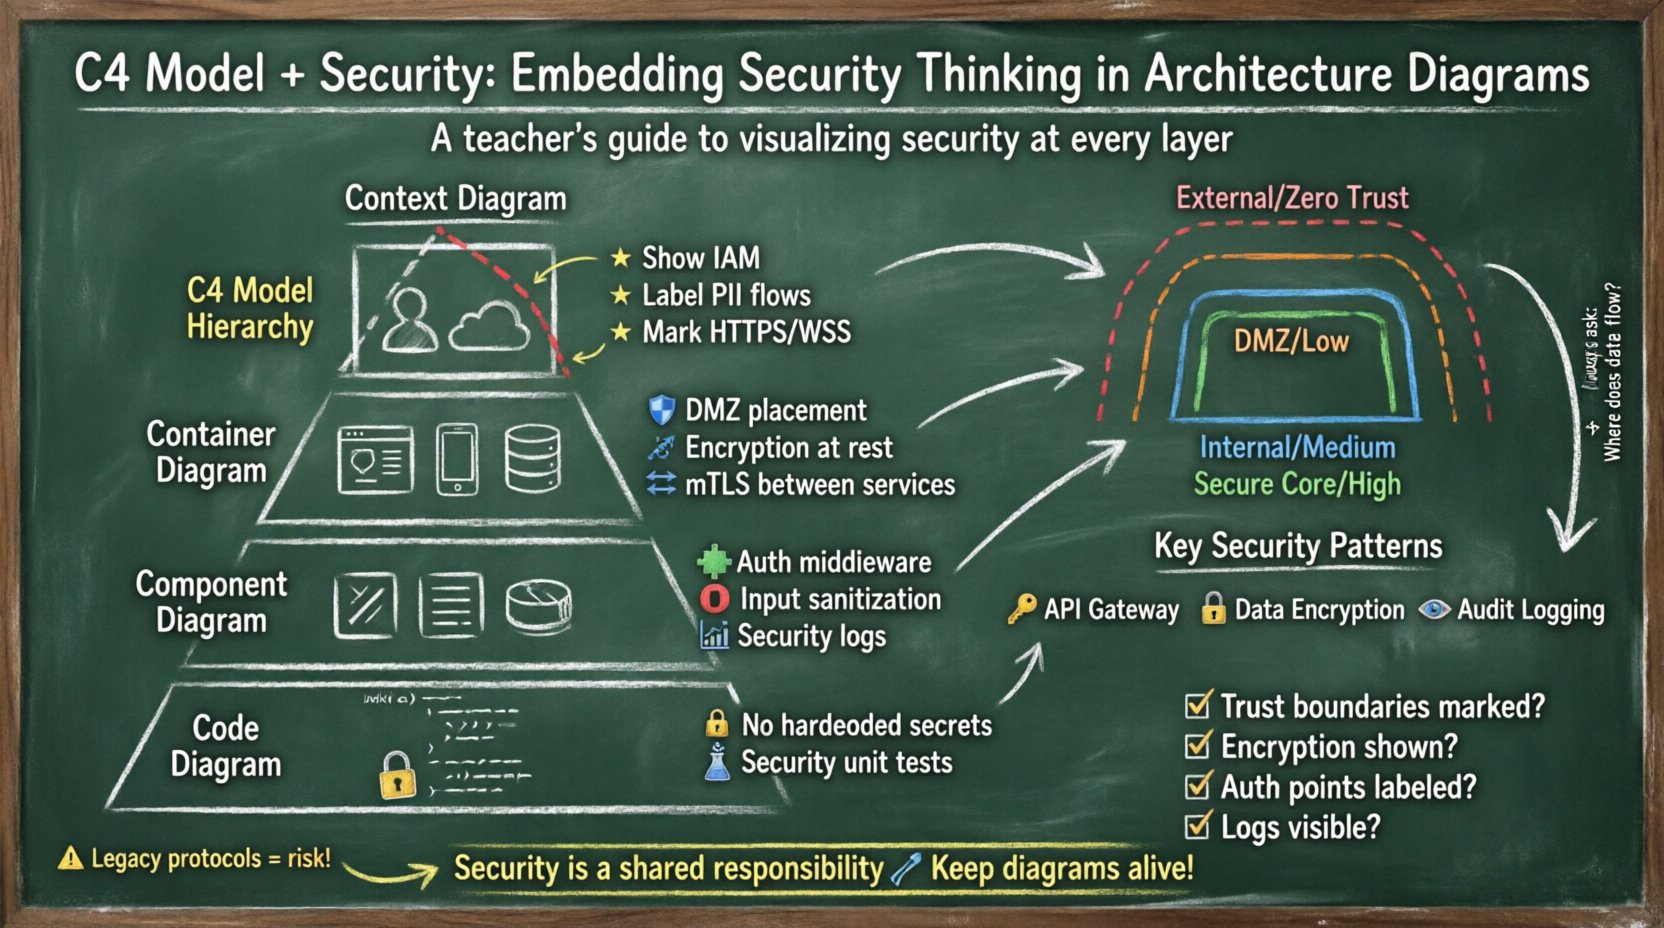
The C4 Model provides a structured approach to documenting software architecture through a hierarchy of diagrams. By integrating security considerations into each level of the C4 hierarchy, architects can create a visual language that communicates risk, compliance, and protection mechanisms clearly. This guide explores how to embed security thinking into Context, Container, Component, and Code level diagrams without relying on specific tools or vendors.
🔍 Why Security Visibility Matters in Diagrams
Security is often invisible until it fails. A firewall blocks traffic, encryption scrambles data, and authentication validates identity. These mechanisms are essential, yet they are rarely depicted in standard design documents. When security is hidden, it becomes difficult to audit, difficult to understand for new team members, and difficult to secure against evolving threats.
Embedding security into architecture diagrams offers several distinct advantages:
- Shared Understanding: Security teams and development teams speak different languages. Visualizing security controls on the same diagram as the application flow aligns their understanding.
- Threat Identification: Diagrams highlight data flows. Every data flow is a potential attack vector. Visualizing these paths makes it easier to identify where data might be exposed or tampered with.
- Compliance Auditing: Regulations often require proof of data protection measures. A well-annotated architecture diagram serves as evidence of design-time security controls.
- Incident Response: During a security incident, understanding where data resides and how it moves is critical. Diagrams provide a map for containment and remediation.
🏗️ Overview of the C4 Model Hierarchy
The C4 Model is a layered approach to software architecture documentation. It scales from the big picture down to the implementation details. Each layer serves a different audience and provides a different level of granularity. Integrating security at the appropriate layer ensures that the right information reaches the right people.
- Context Diagram (Level 1): Describes the system within its environment. It focuses on users and external systems.
- Container Diagram (Level 2): Describes the high-level technical structure. It shows software systems like web apps, mobile apps, and databases.
- Component Diagram (Level 3): Describes the high-level design of a single container. It shows the building blocks like controllers, services, and repositories.
- Code Diagram (Level 4): Describes the implementation of a single component. It shows classes and methods. This is rarely shared externally but is vital for internal security reviews.
🌍 Level 1: Context Diagram Security
The Context Diagram is the entry point. It defines the system boundary. Security at this level is about trust boundaries and identity. You must clearly distinguish between what is inside your trust zone and what is outside.
🔑 Identity and Access Management
At the Context level, the most important security element is authentication. You need to show who is allowed to interact with the system.
- Human Actors: Label users clearly. Distinguish between administrative users and regular end-users. Administrative access often requires stricter controls.
- External Systems: These are often the weakest link. Show how they authenticate. Are they using API keys, OAuth tokens, or mutual TLS?
- Trust Zones: Use visual cues to denote trust boundaries. A solid line might represent a high-trust internal connection, while a dashed line represents a low-trust external connection.
🔗 Data Flow Security
Every line in a Context Diagram represents a data flow. Not all data flows are equal. Some carry sensitive information, while others carry public status updates.
- Encryption Requirements: Mark flows that require encryption in transit. Use labels such as
HTTPSorWSS. - PII Handling: If data contains personally identifiable information, flag the flow. This ensures that downstream teams know to apply additional protections.
- Authentication Mechanisms: Indicate if the flow requires authentication. For example, a
Bearer TokenorSession Cookierequirement should be noted on the connecting line.
📦 Level 2: Container Diagram Security
Once the system boundary is established, the Container Diagram breaks it down into deployable units. This is where the technical security controls become visible. Containers are typically web applications, mobile applications, microservices, or databases.
🛡️ Network Security and Zones
Containers are often distributed across different network zones. Visualizing these zones helps in understanding network segmentation.
- DMZ Placement: Show which containers are exposed to the public internet. These require the highest level of scrutiny.
- Internal Services: Show which containers are internal only. These should not have direct internet exposure.
- Firewall Rules: Use color coding or annotations to indicate which containers are allowed to communicate with each other. This prevents lateral movement in case of a breach.
🔐 Data Protection at Rest
Containers often store data. Whether it is a database, a file store, or a message queue, the storage medium needs security.
- Encryption at Rest: Indicate if data stored in a container is encrypted. This is critical for compliance.
- Key Management: Show where encryption keys are stored. Are they managed by the container itself, or by an external key management service?
- Data Classification: Label containers based on the sensitivity of the data they hold.
Public,Internal,Confidential, orRestricted.
📡 Protocol Security
The protocols used between containers dictate the security posture of the internal communication.
- Internal APIs: Ensure internal APIs are not using plain HTTP. Annotate connections with
HTTPSorgRPC with mTLS. - Service Mesh: If a service mesh is used, indicate that traffic between containers is encrypted and authenticated automatically.
- Legacy Protocols: If a legacy protocol like FTP or unencrypted SMTP is used, highlight this as a risk area that requires remediation.
⚙️ Level 3: Component Diagram Security
The Component Diagram dives inside a single container. It shows the logical building blocks. This is where the logic of security is implemented.
🧩 Authentication and Authorization Logic
Security logic is often distributed across components. It is vital to show where this logic resides.
- Authentication Handlers: Identify components responsible for logging in users. These are high-value targets for attackers.
- Authorization Middleware: Show where access control checks occur. Is it done at the controller level or the service level?
- Token Validation: Indicate components that validate security tokens. If this validation is centralized, it reduces the risk of inconsistent security policies.
🛑 Input Validation and Sanitization
Security breaches often start with bad input. Component diagrams should highlight where input is processed.
- Entry Points: Mark the components that receive external data. These are the first line of defense against injection attacks.
- Sanitization Logic: Show components responsible for cleaning data before it is stored or processed. This prevents SQL injection and cross-site scripting.
- Output Encoding: Indicate where data is encoded before being sent to the user. This ensures that malicious scripts are not executed in the browser.
📊 Logging and Monitoring
Security operations rely on logs. If you cannot see what happened, you cannot detect a breach.
- Security Logs: Identify components that generate security-relevant logs. Examples include failed login attempts, permission denials, and configuration changes.
- Log Aggregation: Show where logs are sent. Are they sent to a centralized logging service? This ensures logs are not lost if a component is compromised.
- Sensitive Data Masking: Indicate if logs are sanitized to prevent leaking credentials or sensitive data.
🧠 Level 4: Code Diagram Security
The Code Diagram is the most detailed level. It shows classes and methods. While this is rarely shared outside the development team, it is essential for deep security reviews.
🔒 Cryptographic Operations
At this level, you can see exactly how cryptography is used.
- Hardcoded Secrets: Check for hardcoded API keys or passwords in the code structure. These should be flagged as critical vulnerabilities.
- Algorithm Usage: Verify that strong algorithms are used. Weak algorithms like MD5 or SHA1 should be avoided.
- Random Number Generation: Ensure that cryptographic random number generators are used for session IDs and tokens.
🧪 Unit Testing for Security
Security requirements must be tested. The code diagram can show where security tests are defined.
- Security Test Cases: Identify methods dedicated to security testing. These should cover authentication bypass, injection, and access control.
- Integration Tests: Show how security controls are tested in the context of the whole system.
🚧 Trust Zones and Boundaries
Across all levels of the C4 model, trust zones are a recurring theme. A trust zone is an area where security controls are consistent and boundaries are well-defined.
| Zone Type | Trust Level | Typical Controls | Diagram Representation |
|---|---|---|---|
| External Internet | Zero Trust | Firewalls, WAF, TLS | Dashed Red Border |
| DMZ | Low Trust | Strict Filtering, Limited Access | Dashed Orange Border |
| Internal Network | Medium Trust | Network Segmentation, Authentication | Solid Blue Border |
| Secure Core | High Trust | Encryption, Key Management, Audit | Solid Green Border |
Visualizing these zones helps stakeholders understand the risk profile of different parts of the system. A breach in the DMZ should not compromise the Secure Core. This concept is known as defense in depth.
🧩 Common Security Patterns in C4
Certain security patterns appear frequently across architectures. Documenting these patterns explicitly saves time and reduces confusion.
🔑 API Gateway Pattern
An API Gateway acts as a single entry point for all client requests. It handles authentication, rate limiting, and routing.
- Placement: It sits between external users and internal containers.
- Security Role: It offloads security logic from individual services, ensuring consistent policy enforcement.
- Diagram Note: Mark the gateway with
AuthN/AuthZlabels.
🔒 Data Encryption Pattern
Data must be protected at rest and in transit. This is a fundamental pattern.
- Transit: Use TLS for all network communication.
- Rest: Encrypt databases and file stores.
- Keys: Store keys separately from data.
👁️ Audit Logging Pattern
Every critical action should be logged. This is essential for forensic analysis.
- What to Log: User actions, system changes, and security events.
- Log Integrity: Ensure logs cannot be tampered with by attackers.
- Retention: Define how long logs are kept for compliance.
🔄 Maintenance and Evolution
Security is not a one-time task. Systems evolve, threats change, and new vulnerabilities are discovered. Architecture diagrams must evolve with them.
📅 Updating Diagrams
When a change is made to the system, the diagram should be updated. This ensures that the documentation remains a source of truth.
- Change Control: Integrate diagram updates into the deployment pipeline.
- Review Cycles: Schedule periodic reviews of the architecture diagrams with the security team.
- Versioning: Keep versions of diagrams to track how security controls have changed over time.
🧪 Threat Modeling Integration
Threat modeling is the process of identifying potential security threats. It works hand-in-hand with C4 diagrams.
- STRIDE Model: Use the STRIDE model (Spoofing, Tampering, Repudiation, Information Disclosure, Denial of Service, Elevation of Privilege) to review each element in the diagram.
- Data Flow Analysis: Walk through every data flow in the diagram. Ask if the data is protected at every step.
- Asset Identification: Identify high-value assets in the diagram. Focus security efforts on protecting these assets.
📝 Checklist for Security Diagrams
Use this checklist to ensure your C4 diagrams are security-ready.
- [ ] Are trust boundaries clearly marked?
- [ ] Is encryption in transit indicated on all data flows?
- [ ] Is encryption at rest indicated for storage containers?
- [ ] Are authentication points labeled?
- [ ] Are sensitive data flows highlighted?
- [ ] Are external dependencies identified and assessed?
- [ ] Are network segments and zones visualized?
- [ ] Are logging and monitoring points shown?
- [ ] Are known vulnerabilities documented?
- [ ] Are diagrams kept up to date with code changes?
💡 Final Thoughts on Security Visualization
Creating secure systems requires more than just writing secure code. It requires a secure design. The C4 Model offers a robust framework for visualizing that design. By embedding security thinking into every layer, from the Context diagram down to the Code level, teams can build systems that are resilient by default.
Security is a shared responsibility. When diagrams clearly communicate security controls, developers, operators, and security engineers can collaborate more effectively. This shared visibility reduces risk and builds confidence in the software being delivered. Remember that a diagram is a living document. It should be treated with the same care as the code it represents.


Comments (0)