C4 Model Case Study: How a Startup Clarified Its Architecture in 3 Days
Software architecture often feels like a black box to new team members. It is a collection of invisible decisions, hidden dependencies, and implicit knowledge that resides only in the minds of senior engineers. When a startup scales rapidly, this opacity becomes a critical risk. Miscommunication leads to bugs, duplicated efforts, and a slow-down in feature delivery. The C4 Model offers a structured approach to visualizing software architecture, but applying it effectively requires discipline and a clear process. This case study details how a growing startup team utilized the C4 Model to map their system in just 72 hours, transforming confusion into clarity without introducing new software overhead.
🧩 Understanding the C4 Model Framework
The C4 Model is a hierarchy of diagrams designed to describe software architecture at different levels of abstraction. It was created to solve the problem of documentation that is either too high-level to be useful or too low-level to be readable. By breaking down the system into four distinct levels, teams can communicate effectively with different stakeholders.
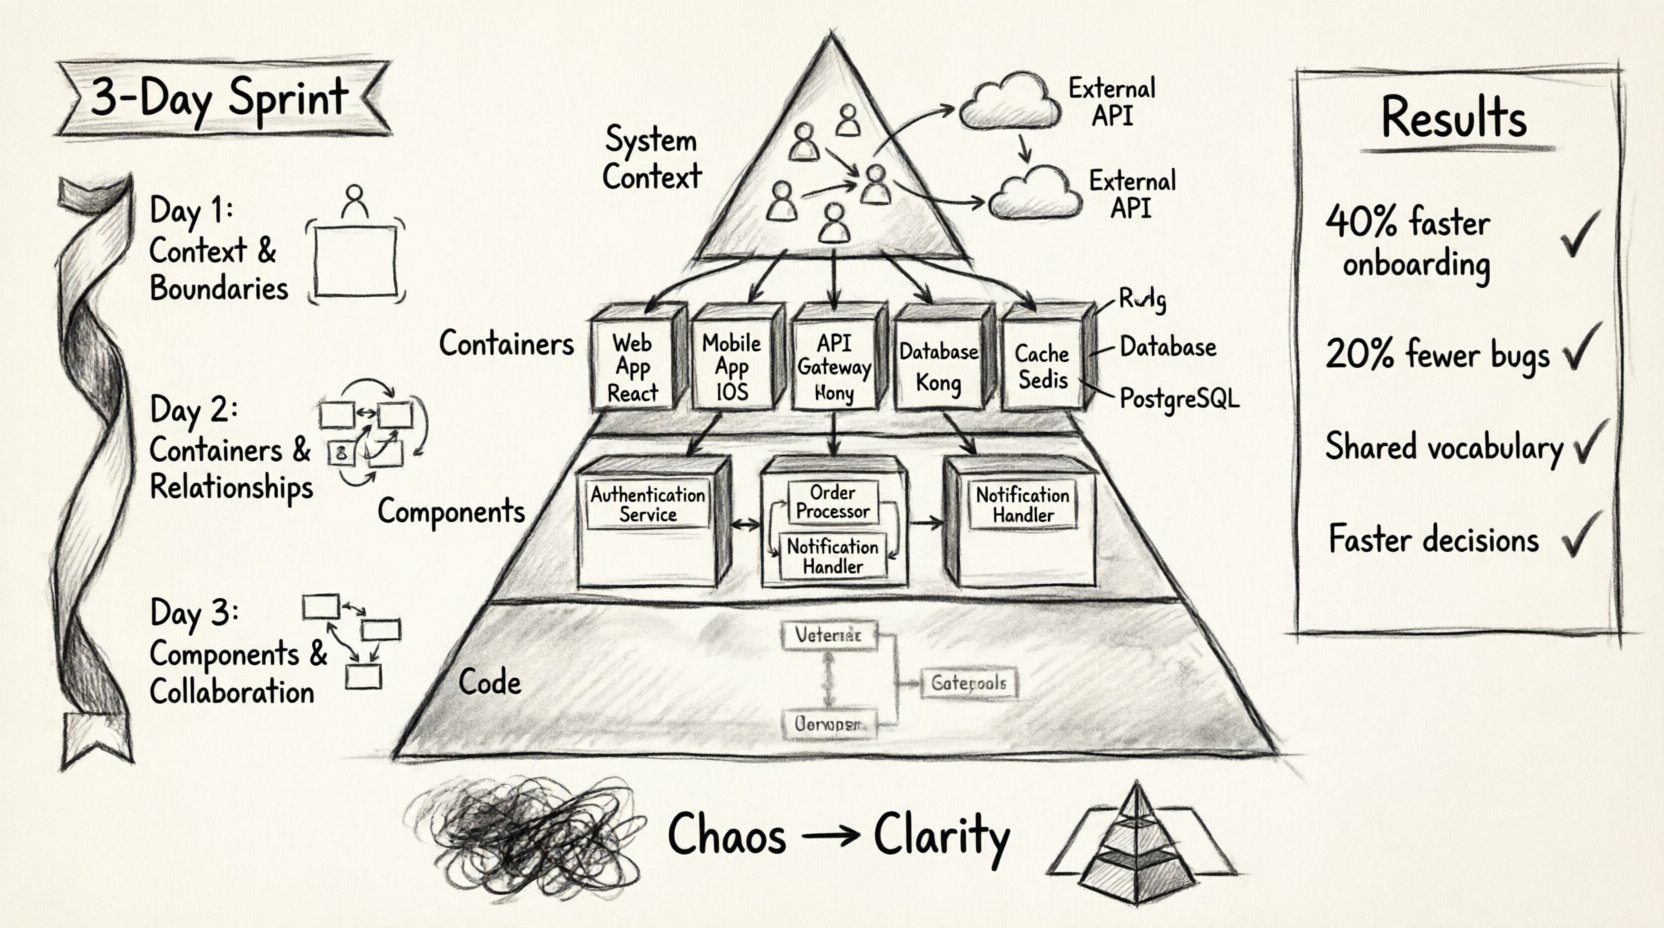
- Level 1: System Context – Shows the software system as a single box and its relationships with users and other systems.
- Level 2: Containers – Breaks the system into distinct processing boundaries, such as web applications, mobile apps, or databases.
- Level 3: Components – Details the internal structure of containers, showing logical groupings of functionality.
- Level 4: Code – Maps to the actual code structure, though this is often optional for high-level architectural discussions.
Each level serves a specific audience. The System Context helps product owners understand the boundaries. The Container view assists DevOps and infrastructure engineers. The Component view is essential for developers working on specific modules. By standardizing these views, the startup ensured that everyone was looking at the same map, regardless of their role.
🌪️ The Startup Scenario: Chaos to Clarity
The startup in this case study was a fintech company experiencing rapid user growth. They had been operating for three years, starting with a monolithic application. As they added features, the codebase grew complex. New hires struggled to understand where one service ended and another began. Technical debt was accumulating because no one had a clear view of the data flow.
Key challenges included:
- Knowledge Silos: Only three senior engineers knew how the entire payment system worked.
- Unclear Boundaries: Microservices were deployed, but the communication protocols were undocumented.
- Slow Onboarding: New developers took weeks to become productive due to lack of documentation.
- Stakeholder Confusion: Product managers could not visualize how changes impacted other areas.
The leadership decided to dedicate three days to architecture documentation. The goal was not to rewrite code, but to document the existing state to facilitate future decisions. They chose the C4 Model because it is language-agnostic and focuses on relationships rather than syntax.
⏱️ The 3-Day Execution Plan
The team split into smaller groups to tackle specific areas. They used a shared workspace to collaborate in real-time. The plan was aggressive but realistic, focusing on the most critical parts of the system first.
Day 1: Context & Boundaries (Level 1)
The first day was dedicated to the System Context diagrams. This level answers the question: “What is this system, and who uses it?” This is crucial for aligning business goals with technical reality.
- Identified Actors: The team listed all external users, including customers, administrators, and third-party APIs.
- Defined Relationships: They mapped how data flows between the application and external services like payment gateways and email providers.
- Established Boundaries: They clearly drew the perimeter of their software system to distinguish what they owned versus what was external.
This session revealed that the team had assumed certain integrations were internal when they were actually external. This distinction was vital for understanding failure modes and latency issues.
Day 2: Containers & Relationships (Level 2)
On the second day, the team drilled down into the Container level. This breaks the system into high-level processing units. This is often the most valuable level for DevOps and infrastructure planning.
- Identified Containers: They cataloged the web application, the mobile app, the API gateway, the primary database, and the caching layer.
- Defined Technologies: Each container was tagged with the technology stack used (e.g., Node.js, PostgreSQL, Redis), without getting into code details.
- Mapped Connections: They drew the lines of communication between containers, noting protocols like HTTPS, gRPC, or SQL.
A significant discovery occurred here: two containers were communicating via a shared database that was not intended to be shared. This “database coupling” was a major bottleneck. Identifying this allowed the team to plan a decoupling strategy for the next quarter.
Day 3: Components & Collaboration (Level 3)
The final day focused on the Component level. This level describes the internal structure of the containers. It helps developers understand how the code is organized logically.
- Grouped Functionality: Inside the API container, they identified components like “Authentication Service,” “Order Processor,” and “Notification Handler.”
- Clarified Dependencies: They documented how these components interacted with each other.
- Reviewed the Diagram: The team held a review session to ensure the diagrams matched the actual codebase.
This level is the bridge between architecture and implementation. It confirmed that the current component structure matched the microservices deployment, validating their infrastructure decisions.
📊 Comparison of C4 Levels
| Level | Focus | Audience | Key Question |
|---|---|---|---|
| System Context | Whole system vs. world | Stakeholders, Product Managers | What does the system do? |
| Containers | High-level processing units | DevOps, Architects | How is the system built? |
| Components | Logical code groupings | Developers | How does the code work? |
| Code | Class structure | Senior Developers | How is it implemented? |
📈 Measurable Outcomes
The investment of three days yielded immediate and long-term benefits. The team moved from undocumented intuition to documented reality.
- Onboarding Time Reduced: New developers could understand the system flow within their first week, cutting onboarding time by 40%.
- Bug Reduction: Misunderstood integrations were identified and fixed, leading to a 20% drop in integration-related bugs.
- Decision Speed: When proposing new features, the team could instantly see if a new container was needed or if an existing component could be reused.
- Shared Vocabulary: The team adopted a common language. Instead of saying “that thing that talks to the database,” they referred to “the API Gateway Container.”
✅ Best Practices for Implementation
Based on this experience, here are the best practices for teams looking to adopt this modeling approach.
- Start High Level: Do not jump straight into code details. Start with the System Context to ensure everyone agrees on the boundaries.
- Keep It Simple: A diagram with too many lines is useless. Focus on the critical paths and the primary data flows.
- Version Control: Store the diagram files in the same repository as the code. This ensures they are updated alongside the software.
- Review Regularly: Architecture is not a one-time task. Schedule reviews during sprint planning to keep diagrams current.
- Collaborative Drawing: Use a shared whiteboard or tool during the creation phase. It is better to draw together than to have one person draw in isolation.
⚠️ Common Pitfalls to Avoid
While the C4 Model is powerful, it is easy to misuse it. Teams often fall into traps that reduce the value of the documentation.
- Over-Engineering: Creating diagrams for every minor feature is unnecessary. Focus on the core architecture first.
- Ignoring Relationships: The boxes are easy, but the arrows are where the truth lies. Do not neglect documenting the protocols and data types on the connections.
- Stale Documentation: If the code changes and the diagram does not, the diagram is now misinformation. Treat documentation as code.
- Tool Dependency: Do not get stuck choosing the perfect software. The value is in the thinking, not the drawing tool. Use whatever allows you to visualize the system quickly.
🔍 Deep Dive: The Component Level Nuance
The Component level often causes the most debate. It is easy to confuse a component with a class or a module. In this case study, the team had to define what a “component” meant for their specific context.
- Logical Grouping: A component should represent a distinct responsibility. For example, “User Management” is a component, not just a folder of files.
- Independence: Components should ideally have limited dependencies on each other to promote testability and maintainability.
- Visibility: Clearly define which components are public and which are internal. This helps manage the API surface area.
By defining these rules upfront, the team avoided the common pitfall of creating a diagram that looked like a class diagram. They focused on the logical boundaries rather than the file structure.
🔄 Iterative Refinement
The initial 3-day sprint was just the beginning. The team established a cadence for updating the diagrams. Every major release cycle included a check to ensure the architecture diagrams were accurate. This iterative approach prevented the documentation from becoming obsolete.
They also created a “Architecture Decision Record” (ADR) process. When a significant change was made, they updated the relevant C4 diagram and documented the rationale. This created a historical record of why the system looked the way it did, which is invaluable for future troubleshooting.
🌐 Impact on External Communication
One unexpected benefit was the impact on external communication. The System Context diagrams were used in sales pitches and investor updates. They provided a clear visual representation of the company’s technical capabilities without requiring a deep technical explanation. This helped non-technical stakeholders understand the complexity of the product and the value of the engineering team.
When discussing partnerships with other companies, the Container level diagrams helped identify integration points quickly. This reduced the time spent on technical due diligence by external partners.
🛠️ No-Code Implementation Strategy
One constraint was avoiding complex tooling. The team used a combination of a standard diagramming tool and a text-based editor. This allowed them to:
- Quickly sketch ideas without learning complex UI features.
- Export diagrams as images for presentations.
- Keep the source files in text format for version control.
This approach ensured that the documentation process did not become a bottleneck. The tools served the process, not the other way around.
🎯 Moving Forward
The success of this initiative shows that architecture documentation is not a burden; it is an investment. By clarifying the system structure, the startup improved their velocity, reduced risk, and enhanced collaboration. The C4 Model provided the structure needed to organize their thoughts, but the discipline to maintain it came from the team.
For organizations considering this path, the recommendation is to start small. Pick one critical service and apply the C4 Model to it. Once the team sees the value, expand to the rest of the system. The goal is clarity, not perfection. A living, evolving set of diagrams is far more valuable than a perfect, static set that no one reads.
As the startup continues to grow, this foundation will support their scaling efforts. The diagrams will serve as the single source of truth for the system’s design, ensuring that knowledge is shared and accessible to everyone involved.


Comments (0)