C4 Model Breakdown: Understanding Context, Containers, Components, and Code
In the complex landscape of software architecture, communication often breaks down. Developers build systems that are difficult to explain, stakeholders struggle to visualize the big picture, and new team members face a steep learning curve. This is where the C4 Model comes into play. It provides a standardized way to visualize the structure and behavior of software systems at multiple levels of abstraction. By organizing diagrams into four distinct layers, teams can maintain clarity without getting lost in technical weeds.
This guide explores the four levels of the C4 Model in detail. We will examine how to construct each view, who the intended audience is, and why this approach leads to more maintainable and understandable systems. The goal is not just to draw boxes, but to create a living documentation that evolves with your code.
🔍 Why the C4 Model Matters
Software architecture diagrams often suffer from the “whiteboard syndrome.” They are created during a meeting, captured quickly, and then never updated again. By the time a developer reads them, they are outdated. The C4 Model addresses this by defining clear boundaries for each level of detail. It prevents the common pitfall of trying to show everything in a single diagram.
Key benefits include:
- Standardization: Everyone understands what a “Container” or “Component” represents.
- Scalability: You can zoom in from a high-level overview down to specific implementation details without losing context.
- Communication: Different stakeholders see exactly what they need to see.
- Maintainability: It is easier to keep documentation in sync with code when the scope is clearly defined.
🏛️ Level 1: System Context
The System Context diagram is the highest level of abstraction. It shows your system as a single black box within the world. This view answers the question: “What does this system do, and who uses it?”
🎯 Purpose and Audience
This diagram is designed for non-technical stakeholders, management, and new hires. It provides a bird’s-eye view without overwhelming them with technical jargon. The audience includes product managers, business analysts, and external partners.
🧱 Key Elements
A Level 1 diagram typically contains three types of boxes:
- The System: Your software is represented as a single box in the center. It should be labeled clearly with the name of the application or service.
- People: Users or roles that interact with the system. These are often represented as human icons.
- Other Systems: External services, databases, or legacy applications that communicate with your system. These are labeled boxes.
🔗 Relationships
Lines connect the central system to the external entities. These lines represent data flow or communication protocols. It is crucial to label these lines with the purpose of the interaction, such as “Processes Orders” or “Synchronizes Data”. Avoid showing internal technical details like ports or specific API endpoints here.
📦 Level 2: Containers
Once the boundaries are established, we open the black box. The Container level reveals the high-level building blocks that make up the system. A container is a distinct, deployable unit of software, such as a web application, a mobile app, a microservice, or a data store.
🎯 Purpose and Audience
This view is for developers, DevOps engineers, and architects. It helps teams understand how the system is deployed and how different parts of the application communicate with each other. It bridges the gap between business requirements and technical implementation.
🧱 Key Elements
A Level 2 diagram expands the central system box from the previous level. Inside, you will find:
- Containers: These are the primary runtime environments. Examples include a web server, a mobile application, a background worker service, or a database.
- Technology Stack: Each container should have a label indicating the technology used, such as “Java Application”, “Node.js Service”, or “PostgreSQL Database”.
- Communication Lines: These lines show how containers talk to one another. Common protocols include HTTP/REST, gRPC, messaging queues, or direct file access.
🔗 Relationships
The connections between containers are critical. They define the boundaries of the system. For example, a web container might call a microservice container over HTTP. That microservice might write to a database container. It is important to distinguish between internal communication and external communication. External communication should match the connections shown in the System Context diagram.
🧩 Level 3: Components
As the system grows, even the Container level can become too broad. The Component level zooms in on a specific container to show its internal structure. A component is a logical grouping of functionality within a container. It is not a physical file, but a conceptual unit of code.
🎯 Purpose and Audience
This diagram is primarily for developers working on that specific container. It helps them understand how to contribute to the codebase without needing to read every line of code immediately. It is also useful for onboarding new developers to a specific module.
🧱 Key Elements
Inside a container, you identify components based on their responsibilities:
- Functionality Groups: Examples include a “User Management Module”, “Payment Processing Engine”, or “Report Generator”.
- Interfaces: Components expose interfaces that other components can use. These are often shown as circles or lollipop symbols.
- Dependencies: Arrows show how components rely on other components to function.
🔗 Relationships
The focus here is on logical flow. If a user requests a report, which components are involved? The “Web Interface” component might call the “Report Generator” component, which in turn queries the “Data Access” component. This level should avoid showing individual classes or functions. If a component diagram becomes too complex, it is a sign that the component itself should be split into smaller containers.
💻 Level 4: Code
The Code level is rarely diagrammed explicitly, but it represents the actual implementation. It shows classes, methods, and data structures. While the C4 Model focuses on the first three levels, understanding the relationship to code is vital.
🎯 Purpose and Audience
This level is for senior developers and code reviewers. It is the bridge between the architectural design and the actual source code. However, drawing a diagram at this level is often discouraged because code changes frequently. Instead, developers should rely on IDE features and code comments for this level of detail.
🧱 Key Elements
- Classes and Interfaces: The atomic units of object-oriented programming.
- Methods and Functions: The specific logic executed.
- Data Models: How data is structured within the code.
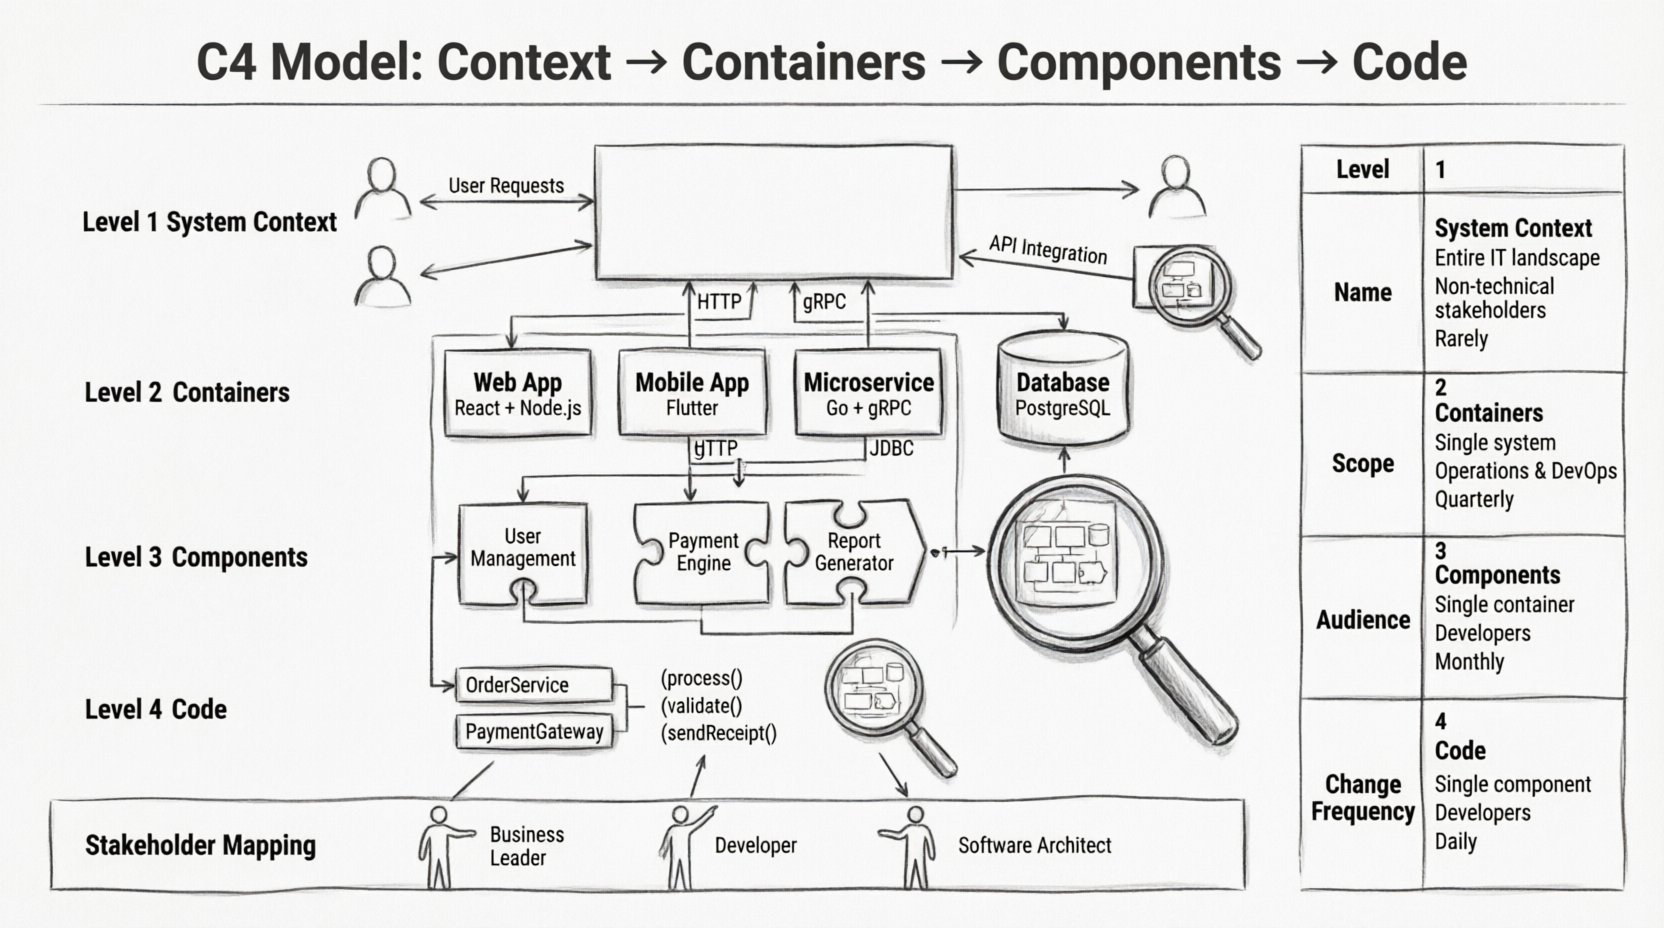
📊 Comparison of C4 Levels
To better understand the distinctions, refer to the following comparison table.
| Level | Name | Scope | Primary Audience | Change Frequency |
|---|---|---|---|---|
| 1 | System Context | Entire System | Stakeholders, Management | Low |
| 2 | Containers | Deployable Units | Developers, DevOps | Medium |
| 3 | Components | Logical Modules | Feature Developers | Medium |
| 4 | Code | Classes & Methods | Code Reviewers | High |
👥 Mapping Stakeholders to Views
One of the strongest aspects of the C4 Model is matching the right diagram to the right person. Using a Level 2 diagram to explain the system to a CEO will confuse them. Using a Level 1 diagram to explain a bug to a backend developer will frustrate them. Here is how to align your documentation:
- Business Owners: Focus on Level 1. They need to know what the system does and who it serves.
- Project Managers: Focus on Level 1 and Level 2. They need to understand dependencies and deployment units for resource planning.
- System Architects: Focus on Level 2 and Level 3. They need to see how containers interact and how components are organized.
- Developers: Focus on Level 3 and Level 4. They need to know where to put their code and how it interacts with other modules.
- Security Auditors: Focus on Level 1 and Level 2. They need to see where data enters and exits the system.
🛠️ Diagramming Best Practices
Creating the diagrams is only half the battle. Maintaining them is where most teams fail. Follow these guidelines to keep your architecture documentation useful.
✅ Consistency is Key
Use consistent naming conventions across all levels. If a container is called “User Service” in Level 2, the component inside should be referred to similarly. Do not switch between “Service”, “Module”, and “App” randomly.
✅ Keep it Simple
Avoid clutter. If a diagram has more than 20 elements, it is likely too detailed. Split it into multiple views. Use whitespace effectively to group related elements. White space is a visual cue that helps the eye rest.
✅ Version Control
Treat your diagrams like code. Store them in the same repository as your source code. Use version control to track changes. This allows you to see how the architecture has evolved over time.
✅ Link to Code
Where possible, link diagrams to the relevant code repositories. If a component diagram shows a “Payment Processor”, link it to the GitHub repository containing that logic. This creates a direct path from documentation to implementation.
⚠️ Common Mistakes to Avoid
Even experienced architects make errors when applying the C4 Model. Being aware of these pitfalls will save you time and confusion.
- Mixing Levels: Do not show component details inside a container diagram. Keep the separation clear. If you must show internal logic, create a separate diagram.
- Over-Engineering: Do not diagram every single class. The C4 Model is about structure, not implementation details. Focus on the boundaries and interactions.
- Ignoring External Systems: In the System Context diagram, do not forget external dependencies. If your system calls an email service, that service must be shown.
- Static Documentation: Do not create diagrams once and forget them. Schedule regular reviews to ensure the diagrams match the current state of the application.
- Using Generic Shapes: Use standard shapes for standard things. Use a human icon for a user. Use a cylinder for a database. Using generic rectangles for everything makes the diagram harder to read.
🔄 Maintenance and Evolution
Software architecture is not a one-time activity. It evolves as the product grows. The C4 Model supports this evolution by allowing you to add detail as needed.
📉 Refactoring and Diagrams
When you refactor code, update the diagrams. If you split a container into two, update Level 2. If you move a component from one container to another, update both the old and new diagrams. This keeps the documentation a source of truth rather than an afterthought.
📈 Scaling Up
As your system scales, you may need more diagrams. A single Level 2 diagram might become too crowded if you have 20 containers. In this case, group containers by domain or function. Create a “Domain View” that shows the major areas of the system, and then drill down into specific domains for detailed diagrams.
🧭 Integrating into Workflows
To make the C4 Model effective, it must be part of your development workflow, not a separate task.
- Design Phase: Create Level 1 and Level 2 diagrams before writing code. This helps identify architectural risks early.
- Code Reviews: Ask developers to update Level 3 diagrams when they add significant new logic. This ensures the component structure remains accurate.
- Onboarding: Require new team members to review the C4 diagrams as part of their orientation. This reduces the time they spend asking basic questions about system structure.
- Incident Response: When a system goes down, the diagrams help quickly identify which container or component is involved, speeding up the troubleshooting process.
🌐 The Future of Architecture Documentation
The principles of the C4 Model are timeless because they focus on clarity rather than specific tools. While tools for drawing diagrams may change, the need to communicate structure remains constant. By adhering to the four levels, you create a flexible documentation strategy that can adapt to new technologies.
Whether you are building a monolith or a distributed microservices architecture, the C4 Model provides a common language. It reduces the cognitive load on everyone involved in the project. It transforms architecture from a hidden, abstract concept into a visible, shared asset.
📝 Summary of Key Takeaways
To wrap up, here are the essential points to remember when implementing the C4 Model:
- Start High: Begin with the System Context to define boundaries.
- Zoom In: Use Containers to show deployment units and Components to show logical groupings.
- Know Your Audience: Match the diagram level to the reader’s needs.
- Maintain Accuracy: Keep diagrams in sync with the codebase.
- Keep it Simple: Avoid over-detailing and mixing levels.
By following these guidelines, you ensure that your architecture documentation serves its primary purpose: enabling clear communication and sustainable development. The effort invested in creating these diagrams pays off in reduced misunderstandings, faster onboarding, and a more resilient system design.
Remember, the goal is not perfection. It is understanding. If your diagrams help you and your team understand the system better, they have succeeded.


Comments (0)