C4 Model for Agile Teams: Visualizing Architecture in Iterative Development
Software development moves quickly. In an agile environment, the pace of delivery often outstrips the clarity of the underlying structure. Teams frequently face a common challenge: as features are added sprint by sprint, the system becomes a tangled web that is difficult to navigate. This is where the C4 Model provides a structured approach to visualizing software architecture without bogging down the development process.
By focusing on abstraction and audience, this model helps engineering teams communicate complex systems effectively. It bridges the gap between high-level strategic planning and low-level implementation details. This guide explores how to integrate the C4 Model into your agile workflows, ensuring that documentation evolves alongside your code.
🧐 Why Architecture Visualization Matters in Agile
Agile methodologies prioritize working software over comprehensive documentation. However, this does not mean documentation is unnecessary. It means documentation must be lean, relevant, and maintainable. Without clear visual aids, new team members struggle to understand the system. Onboarding times increase, and the risk of architectural drift grows.
Visualizing architecture serves several critical functions:
- Communication: Diagrams provide a shared language for developers, product owners, and stakeholders.
- Onboarding: New hires can grasp the system landscape faster than reading code alone.
- Decision Making: Architects and leads can evaluate the impact of changes on the broader system.
- Knowledge Retention: Documentation preserves institutional knowledge even if team members leave.
The C4 Model addresses the common issue of documentation rot. By defining specific levels of detail, it ensures that diagrams remain relevant and do not become overwhelming. Each level targets a specific audience and question, keeping the documentation focused.
🗺️ Understanding the C4 Model Levels
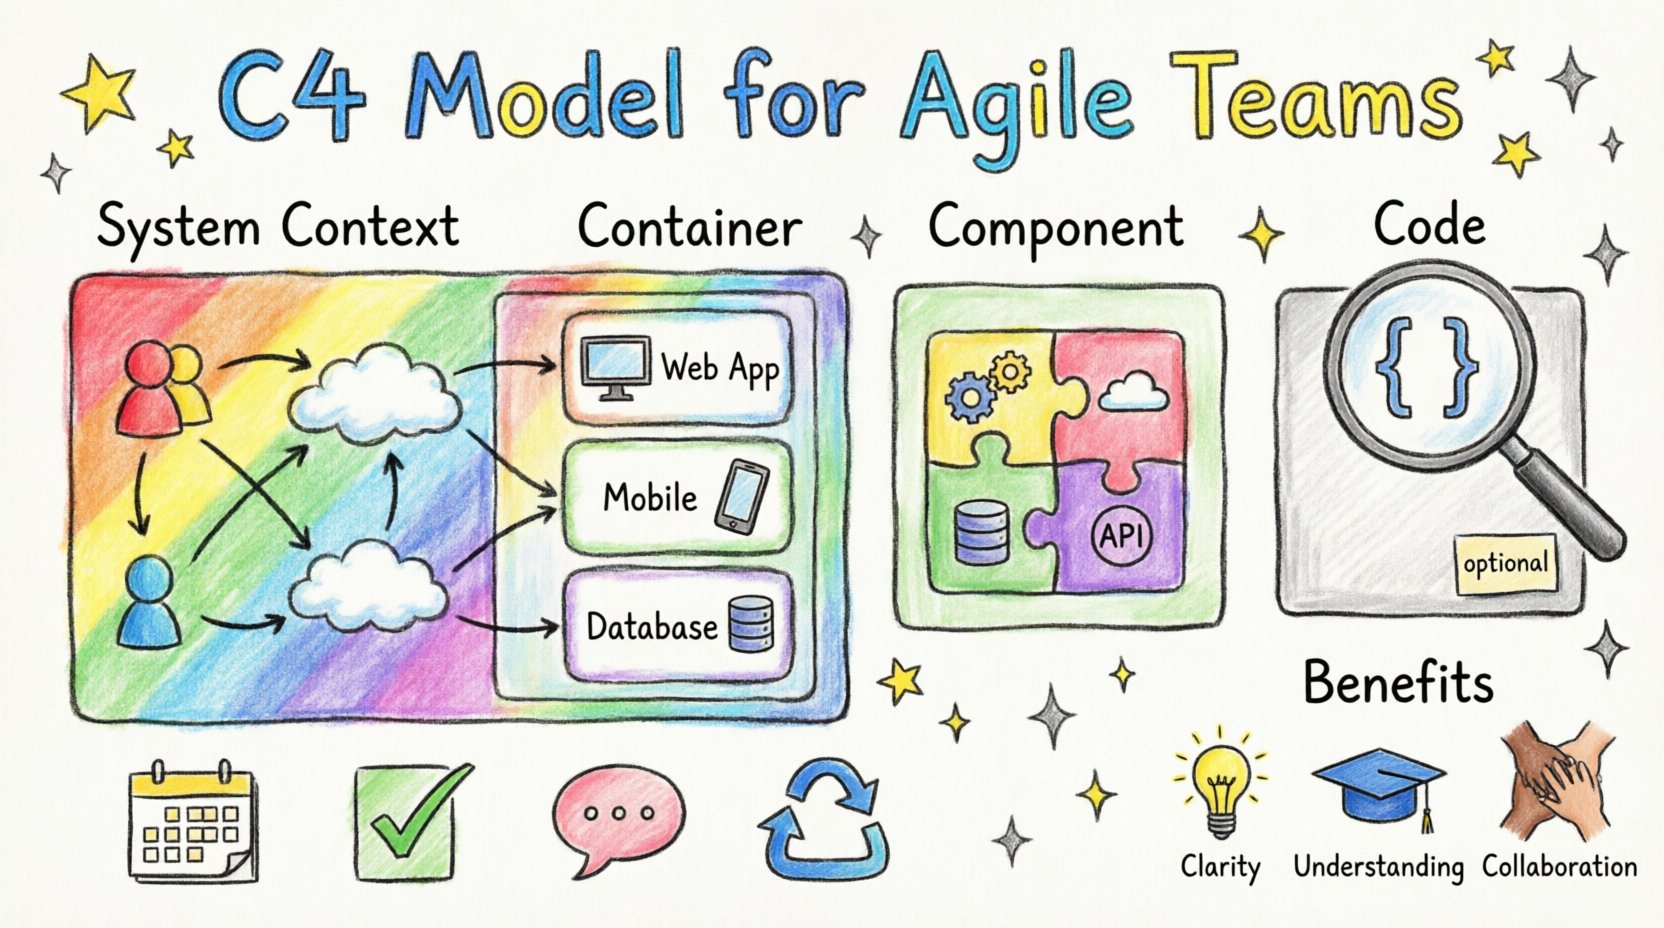
The C4 Model consists of four levels of abstraction. These levels range from the high-level system context down to the specific code implementation. Moving between these levels is like zooming in on a map; you see less detail but gain more specificity.
1. 🌍 Level 1: System Context Diagram
The System Context diagram provides the highest level of view. It answers the question: “What does this system do, and who interacts with it?” This diagram is essential for stakeholders who need to understand the business value and boundaries of the application.
- Content: Shows the system being built as a single box.
- People: Includes users or roles interacting with the system.
- External Systems: Shows other software systems that communicate with the main system.
- Relationships: Arrows indicate data flow or interaction between entities.
This level is typically created during the initial planning phase or when onboarding a new product owner. It sets the stage for understanding where the system fits in the wider ecosystem.
2. 📦 Level 2: Container Diagram
A container represents a distinct unit of deployment. This could be a web application, a mobile app, a microservice, a database, or a file store. The Container diagram answers: “How is the system built?”
- Technology: Specifies the technology stack (e.g., Node.js, PostgreSQL, React).
- Responsibility: Explains what the container does within the system.
- Connections: Shows how containers communicate (e.g., HTTP, gRPC, Message Queue).
This level is crucial for development teams. It helps developers understand the boundaries between services and where their specific code fits within the deployment architecture. It clarifies deployment units without diving into code logic.
3. ⚙️ Level 3: Component Diagram
Within each container, there are components. A component is a logical grouping of functionality, such as a class, a module, or a set of functions. The Component diagram answers: “How is the container structured?”
- Responsibilities: Each component handles a specific part of the business logic.
- Dependencies: Shows how components interact with each other inside the container.
- Interfaces: Defines the public API or entry points for the component.
This level is most useful during the design phase of a specific feature. It allows developers to plan the internal structure of a service before writing code. It ensures that the internal logic remains organized and decoupled.
4. 💻 Level 4: Code Diagram
The Code diagram dives into the specific implementation. It shows classes, functions, and data structures. This level answers: “How is the component implemented?”
- Granularity: Focuses on individual classes and methods.
- Implementation: Details the actual logic and data storage.
- Usage: Best for code reviews or explaining complex algorithms.
While the C4 Model includes this level, it is often optional in agile workflows. Code documentation is frequently better handled directly in the codebase via comments and API specifications. Diagramming code can quickly become outdated as soon as a variable name changes.
📊 Comparison of C4 Model Levels
| Level | Focus | Target Audience | Typical Questions |
|---|---|---|---|
| System Context | System boundaries | Stakeholders, Product Owners | What is this system? |
| Container | Deployment units | Developers, DevOps | How is it built? |
| Component | Internal structure | Developers, Architects | How does it work inside? |
| Code | Implementation details | Developers | How is the logic written? |
🔄 Integrating C4 into Agile Workflows
Integrating architecture visualization into agile development requires discipline. The goal is to create value without creating overhead. The following strategies help teams maintain architecture diagrams alongside rapid iteration.
📝 Backlog Refinement
During backlog refinement, the team breaks down epics into stories. This is a natural point to update the System Context or Container diagrams. If a new external system is being integrated, the context diagram must change. If a new service is being added, the container diagram needs updating.
- Trigger: When a new dependency is identified.
- Action: Sketch the change before accepting the story.
- Benefit: Prevents architectural surprises during development.
🛠️ Sprint Planning
When planning a sprint, developers need to understand the boundaries of their work. The Container and Component diagrams serve as reference points. They ensure that the team understands where their code fits and how it interacts with existing systems.
- Reference: Use diagrams to identify integration points.
- Validation: Ensure proposed changes align with the existing architecture.
- Estimation: Understanding dependencies helps in accurate time estimation.
🗣️ Daily Standups
While diagrams are not discussed daily, the team should be aware of the current state. If a developer encounters an integration issue, referring to the diagram can quickly clarify the expected data flow.
🔄 Retrospectives
Retrospectives are the time to reflect on process improvements. If the diagrams became outdated or were ignored, discuss why. Was the maintenance burden too high? Was the tooling difficult to use? Adjust the workflow based on these insights.
🛠️ Maintaining Diagrams Without Overhead
One of the biggest risks in agile documentation is that diagrams become stale. If a diagram does not reflect the running system, it creates confusion rather than clarity. To prevent this, teams should adopt a “living documentation” mindset.
🔄 Diagrams as Code
Store diagram definitions alongside the source code. This allows version control to track changes to the architecture just like it tracks changes to the application. When a pull request is merged, the diagram updates automatically.
- Version Control: Use Git to manage diagram history.
- CI/CD: Integrate diagram generation into the build pipeline.
- Review: Include diagram updates in pull request reviews.
🎯 Update on Demand
Do not feel pressured to update every diagram at every sprint. Focus on updates that impact the specific audience. If a component refactor happens, update the Component diagram. If a new database is added, update the Container diagram. Prioritize changes that affect decisions.
🚫 Avoid Over-Engineering
Not every system needs a full set of diagrams. Small teams or internal tools might only need a System Context diagram. Scale the documentation effort to the complexity of the project. The goal is clarity, not perfection.
🤝 Enhancing Collaboration
The C4 Model is not just about drawing; it is about conversation. Diagrams facilitate discussions between different parts of the organization.
🌐 Cross-Team Communication
When multiple teams work on the same ecosystem, the Container diagram is vital. It shows where one team’s service ends and another begins. This reduces friction during integration and clarifies ownership boundaries.
👥 Stakeholder Alignment
Non-technical stakeholders often struggle with technical jargon. The System Context diagram translates technical features into business capabilities. It helps product owners see how their requests fit into the overall system landscape.
🧠 Knowledge Sharing
When a team member leaves, the diagrams remain. They serve as a map for the remaining team. This reduces the risk of knowledge loss and speeds up the ramp-up time for replacements.
🚧 Common Pitfalls to Avoid
Implementing the C4 Model requires awareness of common mistakes. Avoiding these pitfalls ensures the model remains useful.
- Too Much Detail: Including too many components in a diagram makes it unreadable. Stick to the level of abstraction required for the audience.
- Outdated Artifacts: A stale diagram is worse than no diagram. Ensure updates are part of the definition of done.
- Ignoring the Audience: Do not show code diagrams to product owners. Do not show context diagrams to developers looking for API details.
- Lack of Standards: Define naming conventions for boxes and arrows. Consistency makes diagrams easier to read.
- Manual Maintenance: If diagrams are drawn manually and not updated, they will rot. Automate where possible.
📈 Measuring Success
How do you know if the C4 Model is working? Look for these indicators within your team.
- Faster Onboarding: New developers understand the system faster.
- Fewer Integration Bugs: Clear boundaries reduce interface errors.
- Better Decisions: Architecture decisions are documented and reasoned.
- Active Usage: Team members reference diagrams in meetings and planning.
🔮 Looking Ahead
As software systems become more distributed and complex, the need for clear visualization grows. The C4 Model offers a flexible framework that adapts to different project sizes and team structures. By focusing on the right level of detail for the right audience, teams can maintain architectural clarity without sacrificing agility.
The key is consistency. Treat diagrams as living artifacts that evolve with the software. This approach ensures that the architecture remains a guide rather than an obstacle. With the right discipline, the C4 Model becomes an integral part of the development culture, supporting both speed and stability.
Start small. Create a System Context diagram for your current project. Share it with your team. Gather feedback. Then, expand to the Container level if needed. The journey toward better architecture visualization is iterative, just like the development process itself.


Comments (0)