C4 Model vs. Traditional Diagrams: What Architects Need to Know
Software architecture documentation often becomes a bottleneck rather than a bridge. Teams struggle with diagrams that are too complex to read or too vague to be useful. As systems grow in complexity, the choice of visualization methodology directly impacts communication efficiency and long-term maintenance. The C4 Model has emerged as a structured approach to system design, yet many organizations still rely on traditional diagramming techniques. Understanding the distinctions, strengths, and limitations of each is essential for effective technical leadership.
🤔 The Problem with Legacy Visualization
For decades, the industry has leaned heavily on Unified Modeling Language (UML) and Entity-Relationship Diagrams (ERD). While these standards offer precision, they often introduce significant cognitive overhead. A single class diagram might require a team to understand inheritance hierarchies, interfaces, and associations before grasping the actual business flow. This granularity, while mathematically sound, frequently fails to serve the primary purpose of architecture documentation: communication.
When architects produce dense diagrams without a clear audience in mind, several issues arise:
- Loss of Context: Details obscure the high-level structure.
- Maintenance Debt: Diagrams become outdated quickly as code evolves.
- Communication Barriers: Stakeholders find the syntax intimidating.
- Focus Shift: Effort moves from design to documentation syntax.
Without a standardized approach, teams create their own notation styles, leading to a fragmented knowledge base where no two diagrams mean the same thing. This inconsistency complicates onboarding and hinders cross-team collaboration.
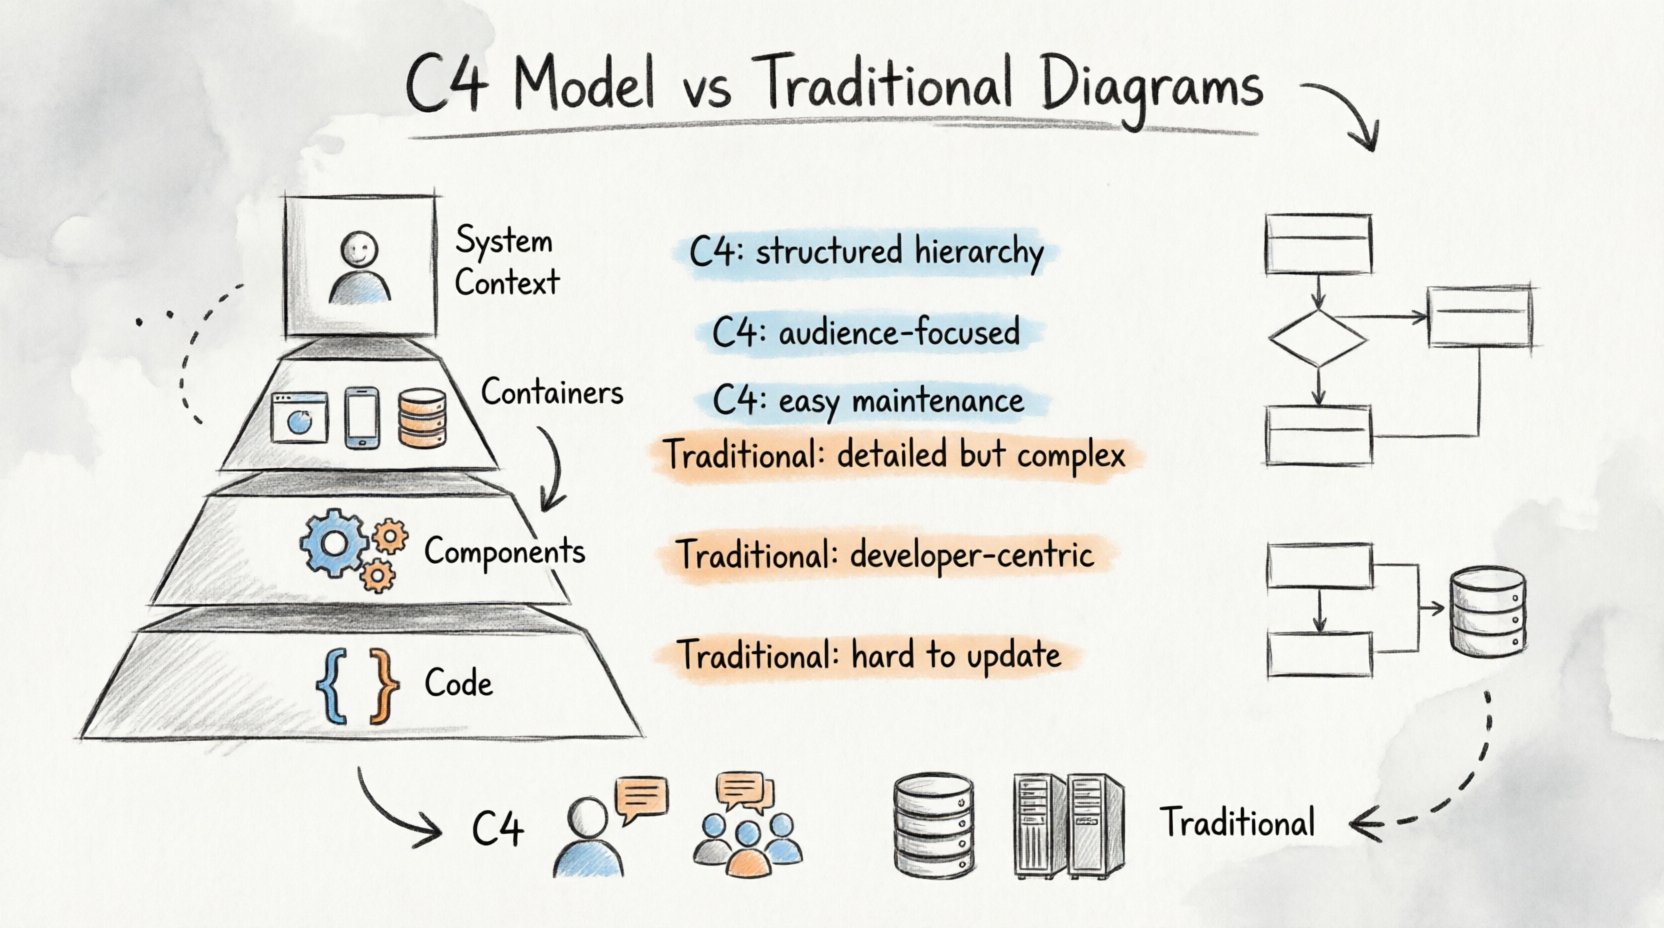
🧩 Understanding the C4 Model
The C4 Model provides a hierarchical set of diagrams to help developers and architects visualize the structure and dynamic aspects of software systems. It focuses on abstraction levels, allowing readers to zoom in or out depending on their needs. This scalability prevents the clutter often found in monolithic diagrams.
Level 1: System Context 🌍
The top level answers the question, “What does this system do, and who uses it?” It depicts the system as a single box and shows how it interacts with users and external systems. This view is critical for stakeholders who need to understand the system’s place in the broader ecosystem without worrying about internal logic.
- Focus: Boundaries and relationships.
- Audience: Business stakeholders, product owners, new hires.
- Detail: Minimal. No internal components are shown.
Level 2: Containers 📦
Drilling down further, the Container diagram breaks the system into major building blocks. A container is a runtime environment, such as a web application, a mobile app, a database, or a microservice. This level clarifies the technology choices and the data flow between distinct runtime environments.
- Focus: Runtime environments and data stores.
- Audience: Developers, system integrators, DevOps engineers.
- Detail: Shows technology stacks (e.g., Java, SQL, React).
Level 3: Components ⚙️
Within a container, the Component diagram reveals the logical structure. It breaks down a container into smaller, cohesive units of functionality. Unlike class diagrams, components are not tied to specific programming constructs but represent logical groupings of responsibilities.
- Focus: Functional modules within a container.
- Audience: Core development teams, feature owners.
- Detail: Shows inputs, outputs, and internal interactions.
Level 4: Code 💻
The lowest level maps to the actual code. It is essentially a standard class or sequence diagram. This level is usually reserved for specific feature implementations or complex algorithms where the structure of the code matters significantly.
- Focus: Class structures and method interactions.
- Audience: Implementing developers.
- Detail: High technical granularity.
📊 Head-to-Head Comparison
To clearly see the differences, we can compare the C4 Model against traditional diagramming approaches across several key dimensions. This comparison highlights why many modern teams are shifting their documentation strategy.
| Dimension | C4 Model | Traditional (UML/ERD) |
|---|---|---|
| Abstraction Level | Structured hierarchy (Context to Code) | Often flat or mixed levels |
| Audience Fit | Designed for specific roles | Generic, often developer-centric |
| Maintenance | High (easy to update per level) | Low (changes cascade easily) |
| Readability | High (focus on boxes and lines) | Variable (depends on notation) |
| Technology Agnostic | Yes | Often tied to specific languages |
| Focus | System behavior and boundaries | Class relationships and data |
🚦 When to Use Which Approach
While the C4 Model offers significant advantages for high-level architecture, traditional diagrams still hold value in specific scenarios. A balanced documentation strategy often leverages both, using the right tool for the specific problem at hand.
Where C4 Excels 🏆
- Onboarding: New team members can grasp the system quickly using Context and Container diagrams.
- Integration Planning: Understanding how services communicate is clearer with container-level views.
- Refactoring: Identifying logical boundaries for splitting monoliths is easier with component views.
- Stakeholder Reporting: Business leaders prefer the high-level context view over technical class structures.
Where Traditional Diagrams Remain Useful ⚙️
- Database Schema: ERDs remain the gold standard for defining relational data structures.
- Complex Algorithms: Sequence diagrams are still necessary for intricate logic flows.
- Legacy Systems: Existing documentation may be entrenched in UML standards.
- Performance Tuning: Detailed class interactions can help identify bottlenecks in specific modules.
⚠️ Common Pitfalls in Traditional Diagramming
Many teams continue using traditional methods not because they are the best fit, but because of habit. Recognizing the pitfalls helps in making a conscious decision to adopt a better approach.
1. Over-Engineering the Diagram
It is easy to spend hours perfecting the layout, color, and font of a diagram that no one will read. Traditional tools often encourage this focus on aesthetics rather than clarity. The goal of architecture documentation is understanding, not presentation art.
2. The “Living Document” Fallacy
Diagrams are often treated as static artifacts stored in a repository. When code changes, the diagram does not automatically update. This leads to a divergence where the documentation no longer reflects reality. Teams must accept that diagrams are code and require the same version control and review processes.
3. Lack of Standardization
Without a model like C4, one developer might draw a database as a cylinder while another uses a box. These inconsistencies create confusion during reviews and audits. A standardized set of notations ensures that every team member interprets the diagram the same way.
4. Ignoring the Audience
Showing a complex sequence diagram to a product manager is ineffective. They need to know the feature flow, not the method calls. Traditional diagrams often default to technical detail, alienating non-technical stakeholders who need to approve budgets or timelines.
🛠️ Best Practices for Implementation
Moving to a new diagramming standard requires discipline. Here are practical steps to ensure success without disrupting current workflows.
- Start Small: Do not attempt to diagram the entire system at once. Begin with the System Context for the most critical service.
- Define Rules: Establish a style guide for your organization. What colors mean what? How are external systems represented?
- Automate Where Possible: Use tools that generate diagrams from code or configuration to reduce manual maintenance.
- Review Regularly: Include diagram updates in the definition of done for pull requests. If the code changes, the diagram must change.
- Keep it Simple: If a diagram has more than 20 boxes, it is likely too complex. Split it into multiple views.
🔄 Evolution and Maintenance
Documentation is not a one-time task. It is a continuous process that evolves with the system. The C4 Model supports this by allowing different levels of detail to be maintained independently. You might update the Component level without touching the Context level.
Teams should schedule periodic audits of their architecture documentation. Ask the following questions:
- Is this diagram still accurate?
- Is anyone using this diagram?
- Does this diagram help solve a problem?
If the answer to the last question is no, consider removing it. Bloat is the enemy of clarity. A smaller set of high-quality diagrams is more valuable than a library of outdated ones.
🧭 Strategic Decision Making
Choosing between C4 and traditional methods is not about discarding one for the other entirely. It is about selecting the right abstraction for the task. For system design reviews, C4 provides the necessary structure. For database design, ERD remains relevant. For logic flow, sequence diagrams are still powerful.
The key is intentionality. Every diagram created should have a defined purpose and a defined audience. If you cannot state who will read this and why, do not create it.
📝 Conclusion on Documentation Strategy
Architecture documentation serves as the backbone of technical communication. By adopting structured models like C4, teams can reduce ambiguity and improve collaboration. Traditional diagrams have their place, but they often fail to scale with modern system complexity. Prioritizing clarity, maintenance, and audience alignment ensures that documentation adds value rather than becoming a burden.
Investing time in the right visualization method pays dividends in reduced onboarding time, fewer integration errors, and clearer strategic discussions. The goal is not to create pretty pictures, but to create maps that guide the team through the system landscape effectively.


Comments (0)