C4 Model Troubleshooting: Fixing Misleading or Confusing Diagrams
Software architecture documentation often becomes a bottleneck rather than a bridge. You have invested time in creating diagrams, yet stakeholders still ask, “How does this actually work?” or “Where does this data go?”. The issue is rarely the content; it is usually the representation. The C4 model provides a structured hierarchy for visualizing software architecture, but even with this framework, diagrams can become misleading, cluttered, or confusing.
This guide addresses the specific friction points that occur when applying the C4 model. We will move beyond basic definitions and dive into troubleshooting common pitfalls. By the end, you will understand how to diagnose visual noise, correct structural errors, and ensure your diagrams serve their intended purpose: communication.
Understanding Why Diagrams Fail 🔍
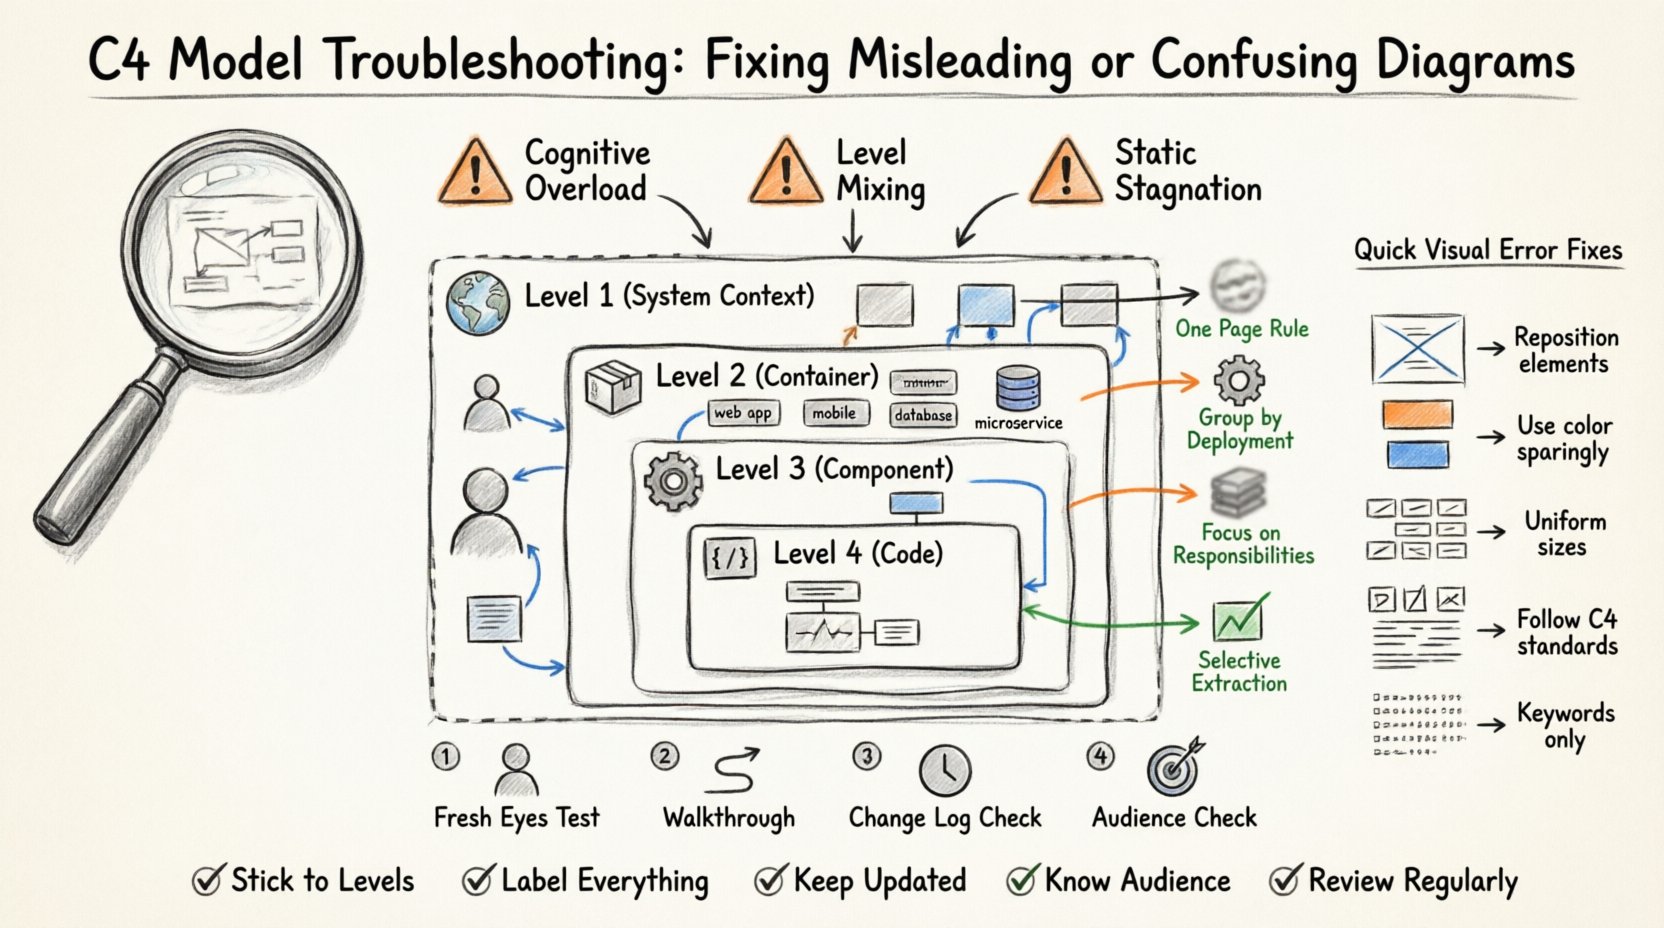
Before fixing a diagram, you must identify the root cause of the confusion. Poor diagrams typically suffer from one of three fundamental issues:
- Cognitive Overload: Too much information is presented at once, overwhelming the viewer.
- Level Mixing: Different layers of abstraction are combined, blurring the boundaries of scope.
- Static Stagnation: The diagram does not reflect the current state of the system, leading to distrust.
When a diagram is confusing, it is usually because the mental model of the reader cannot align with the visual model presented. The C4 model is designed to mitigate this by separating concerns into distinct views. Troubleshooting involves ensuring these views remain distinct and accurate.
Level 1: System Context Diagram Troubleshooting 🌍
The System Context diagram is the highest level of abstraction. It shows the software system, its users, and the external systems it interacts with. This is often the most critical diagram for non-technical stakeholders. When this level fails, the entire documentation effort loses credibility.
Common Pitfalls
- Missing Users: Omitting the human actors who initiate actions creates a gap in understanding who the system serves.
- Too Many External Systems: Listing every dependency creates noise. Only include systems that have a meaningful data exchange or critical dependency.
- Unclear Boundaries: If the system boundary is not distinct, it is unclear what is internal and what is external.
- Generic Labels: Using terms like “Database” instead of “Customer Database” reduces clarity.
Fixing the Context View
To troubleshoot a cluttered context diagram, apply the following filters:
- Apply the “One Page” Rule: If the diagram requires scrolling or zooming, it is too detailed. Move the extra systems to a lower level or a separate diagram.
- Refine Relationship Lines: Ensure arrows indicate the direction of data flow correctly. Does the system send data to the external system, or does it receive data?
- Validate Actors: Check if every actor has a clear role. Avoid generic “User” icons without specifying roles like “Administrator” or “Customer”.
- Consistent Styling: Use standard shapes for people (stick figures or avatars) and systems (rectangles or cylinders) to maintain consistency with the C4 specification.
Level 2: Container Diagram Troubleshooting 📦
The Container diagram breaks the system down into deployable units. A container represents a distinct runtime environment, such as a web application, a mobile app, a database, or a microservice. This is where architectural decisions regarding technology stacks become visible.
Common Pitfalls
- Microservices Confusion: Treating a single logical service as multiple containers, or vice versa, creates confusion about deployment boundaries.
- Technology Stacking: Listing every library or framework used within a container violates the abstraction level.
- Overlapping Boundaries: Containers should not overlap. If two containers share data, there should be a clear line connecting them.
- Missing Protocols: Failing to label the communication protocol (e.g., HTTP, gRPC, SQL) makes the integration unclear.
Fixing the Container View
When reviewing a container diagram, focus on the runtime boundaries:
- Group by Deployment: Ensure that containers that are deployed together are not split apart unnecessarily. A single monolith should not be split into multiple containers unless distinct processes are running.
- Clarify Data Ownership: If a container holds data, label it as a database or file store. Distinguish between transient data and persistent storage.
- Simplify Connections: If multiple containers talk to the same external system, consider if a single line with a clear label is sufficient, or if separate lines add value.
- Check for Orphaned Components: Ensure every container is connected to at least one other system or actor. An isolated container suggests a broken architecture.
Level 3: Component Diagram Troubleshooting ⚙️
The Component diagram zooms in on a specific container to show the internal building blocks. This is often where the most confusion arises because it touches on implementation details without showing code. It represents the logical structure.
Common Pitfalls
- Implementation Leakage: Showing database tables or class files instead of logical components.
- Too Many Components: A single container with 50+ components is unreadable. Group related functionality.
- Unlabeled Interfaces: Components should expose interfaces. If lines connect without labels, the nature of the interaction is unknown.
- Missing Responsibilities: If a component’s purpose is not obvious from its name, it needs a description.
Fixing the Component View
To resolve confusion at this level, adhere to logical grouping:
- Use Standard Shapes: Use standard shapes for components (like rounded rectangles) and interfaces (often a ball-and-socket notation or labeled lines).
- Focus on Responsibilities: Name components based on what they do (e.g., “Order Processor”) rather than what they are (e.g., “Order Class”).
- Abstract Logic: Do not show the logic flow inside the component. Focus on the interaction between components, not the internal algorithm.
- Limit Depth: If a component needs its own component diagram, it is likely too complex. Consider splitting the container or simplifying the current view.
Level 4: Code Diagram Troubleshooting 💻
The Code diagram is the most detailed view, typically showing classes, interfaces, and relationships. This is rarely needed for architecture documentation unless you are onboarding new developers to a complex module. Misuse here is common.
Common Pitfalls
- Excessive Detail: Showing every method and property creates visual noise.
- Outdated Metadata: Code diagrams update frequently. If the code changes but the diagram does not, trust is lost.
- Irrelevant Relationships: Showing inheritance or dependency for every class distracts from the core flow.
Fixing the Code View
- Selective Extraction: Only diagram the critical paths or complex logic blocks. Do not diagram simple data transfer objects.
- Focus on Structure: Highlight the structural relationships that define the architecture, not the implementation details.
- Automate Where Possible: If possible, generate these views from the codebase to ensure accuracy, then prune the view for readability.
Cross-Level Consistency Issues 🔄
One of the most frequent sources of confusion is inconsistency between levels. A user expects a relationship shown in the Context diagram to exist in the Container diagram, but it is missing. Troubleshooting requires cross-referencing.
Use the following checklist to ensure consistency:
- Flow Verification: Does the data flow in the Context diagram match the connections in the Container diagram?
- Scope Alignment: Does the system boundary in the Context diagram encompass all containers in the Container diagram?
- Terminology: Are terms used consistently across all diagrams? Do not use “Service A” in one diagram and “Backend API” in another for the same entity.
- Relationship Cardinality: Ensure the number of connections makes sense. A single database container should not connect to every container unless it is a shared service.
Diagnosing Specific Visual Errors 📋
Sometimes the issue is purely visual. The following table summarizes common visual errors and their solutions.
| Visual Error | Impact | Resolution |
|---|---|---|
| Line Crossing | Increases cognitive load and confusion | Reposition elements to minimize crossings or use orthogonal routing. |
| Color Overload | Distractions and lack of focus | Use color sparingly to highlight specific flows or types only. |
| Inconsistent Sizing | Implies hierarchy where none exists | Keep elements of the same level uniform in size. |
| Mixed Notation | Confusing representation of concepts | Adhere strictly to C4 standard shapes and icons. |
| Text Density | Hard to read quickly | Reduce text to keywords. Use descriptions for details. |
The Review Process for Documentation 📝
Creating a diagram is only half the work. Reviewing it is where you catch the errors that cause confusion. A structured review process ensures quality.
Step 1: The Fresh Eyes Test
Show the diagram to someone who did not build it. Ask them to explain the flow without your help. If they hesitate or misinterpret a connection, the diagram is flawed. This is the most effective way to identify ambiguity.
Step 2: The Walkthrough
Trace a specific user journey on the diagram. Start from the actor and follow the lines to the database. Does every step have a corresponding element? If the journey jumps over a gap, the diagram is misleading.
Step 3: The Change Log Check
Compare the diagram against recent code changes. Has a new dependency been added? Has a service been deprecated? If the diagram is not updated with the change log, it becomes a liability rather than an asset.
Step 4: The Audience Check
Ask who the diagram is for. If it is for developers, the Component level is appropriate. If it is for management, the System Context is better. Do not present a Component diagram to an executive board expecting them to understand the internal logic.
Handling Ambiguity in Relationships 🔗
A common source of troubleshooting is the ambiguity of relationship lines. In the C4 model, lines represent data flows. However, the nature of that flow can be complex.
- One-Way vs. Two-Way: Clearly label the direction. If data flows both ways, use a double-headed arrow.
- Synchronous vs. Asynchronous: Distinguish between a direct call and an event trigger. Use different line styles or labels to indicate message queues or event streams.
- Authentication: If a connection requires security, indicate this. A simple line implies trust; a secure line implies authentication is required.
When troubleshooting a confusing connection, ask: “What is the contract?” If the contract is unclear, the diagram fails. Add labels to the lines to specify the payload or the action being performed.
Managing Complexity in Large Systems 🏗️
Large systems often require multiple diagrams for a single container. This fragmentation can lead to confusion if not managed well.
- Naming Conventions: Use clear naming for related diagrams. Instead of “Container Diagram 1,” use “Payment Service Container Diagram.”
- Navigation: Ensure there is a way to navigate between diagrams. Links should be clear.
- Summary Views: Create a summary diagram that links to the detailed views. This allows users to jump from high-level to low-level without getting lost.
- Version Control: Store diagrams alongside code. This ensures that the diagram evolves with the system.
Summary of Best Practices ✅
To maintain clarity and avoid the pitfalls discussed, follow these core principles:
- Stick to the Levels: Do not mix System Context details into the Container diagram.
- Label Everything: Connections, components, and actors should have meaningful labels.
- Keep it Updated: An outdated diagram is worse than no diagram at all.
- Know Your Audience: Tailor the level of detail to the reader.
- Review Regularly: Schedule diagram reviews as part of the development lifecycle.
By treating diagrams as living documents rather than static artifacts, you ensure they remain valuable tools for communication. Troubleshooting is not about finding errors; it is about refining the signal to noise ratio. When you successfully resolve these issues, the architecture becomes transparent, and the team moves forward with confidence.
Start by auditing your current diagrams against this guide. Identify one level that feels confusing, apply the specific fixes for that level, and measure the improvement in team understanding. Documentation is a practice of clarity, and the C4 model is a powerful framework to achieve it.


Comments (0)