Tags:
Quick Start Guide to Using the Five Forces Model Today
Understanding the structure of an industry is fundamental to strategic planning. The Porter’s Five Forces Model remains one of the most enduring frameworks for analyzing competitive dynamics. This guide provides a detailed roadmap for applying this tool effectively. Whether you are evaluating a new market entry or refining an existing business strategy, this analysis helps clarify where power lies and where risks exist.
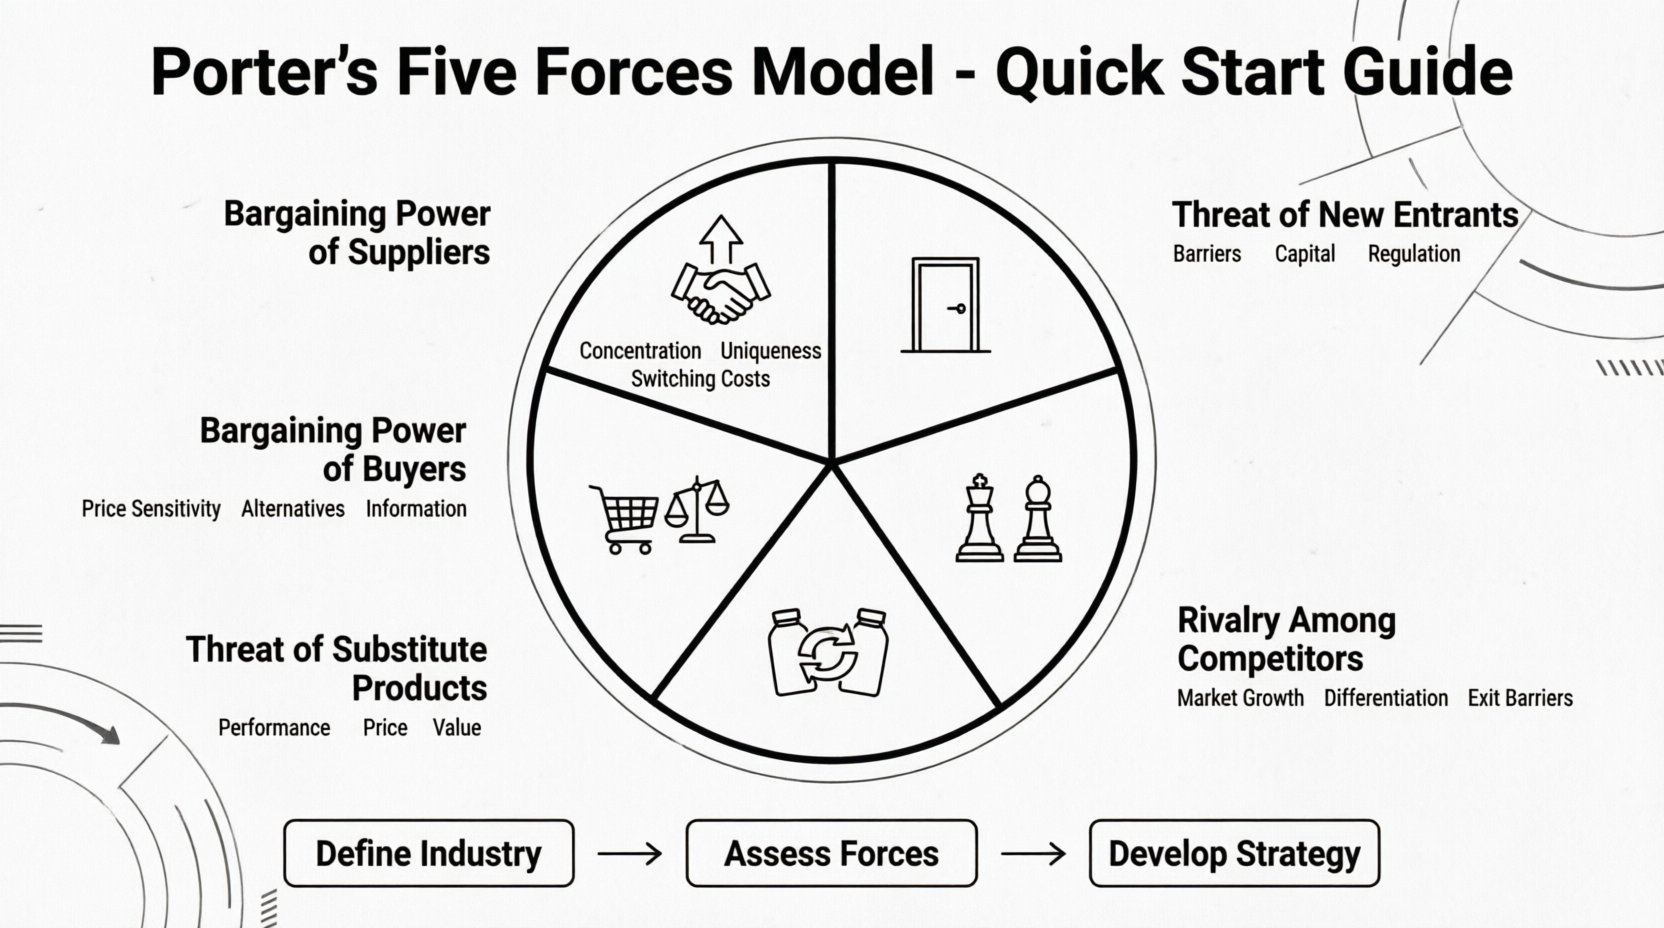
Developed by Michael Porter in 1979, this framework identifies five specific forces that shape every market and industry. These forces determine the intensity of competition and the profitability of an industry. By assessing each force individually, organizations can make informed decisions about resource allocation and long-term positioning.
🔍 Why This Analysis Matters
Strategic decisions often fail when they rely solely on internal capabilities without considering external pressures. A product might be excellent, but if supplier power is too high or buyer power is too strong, margins will suffer. This model shifts focus from internal operations to the broader ecosystem.
- Market Attractiveness: It helps determine if an industry is worth entering.
- Risk Identification: It highlights potential threats before they become crises.
- Competitive Advantage: It reveals where a company can differentiate itself.
- Resource Allocation: It guides where to invest capital for maximum return.
🏗️ The Five Forces Explained
Each force represents a specific type of threat or pressure. To use this model effectively, you must understand the drivers behind each force.
1️⃣ Threat of New Entrants
This force measures how easy or difficult it is for new competitors to enter the market. High barriers to entry protect existing players, while low barriers invite disruption.
Key Factors to Consider:
- Capital Requirements: How much money is needed to start operations?
- Regulatory Barriers: Are there licenses or permits required?
- Access to Distribution Channels: Can new players reach customers easily?
- Switching Costs: Is it hard for customers to change providers?
- Brand Loyalty: Do customers prefer established names?
Strategic Implications:
- If the threat is High, focus on building moats through patents, exclusive contracts, or massive scale.
- If the threat is Low, you can maintain current strategies but watch for agile startups.
2️⃣ Bargaining Power of Suppliers
Suppliers can drive up prices or reduce quality if they hold significant leverage. This force examines the relationship between your organization and its vendors.
Key Factors to Consider:
- Number of Suppliers: Are there many options or just a few?
- Uniqueness of Product: Are the inputs specialized or commoditized?
- Switching Costs: How much does it cost to change suppliers?
- Threat of Forward Integration: Can suppliers become your competitors?
- Importance of Volume: Is your business a major customer to them?
Strategic Implications:
- If supplier power is High, consider vertical integration or diversifying your supply chain.
- If supplier power is Low, negotiate aggressively on price and terms.
3️⃣ Bargaining Power of Buyers
Customers can demand lower prices or higher quality. Their power increases when they have many choices or when the product is undifferentiated.
Key Factors to Consider:
- Concentration of Buyers: Are there a few large buyers or many small ones?
- Price Sensitivity: How much does price affect the purchase decision?
- Availability of Alternatives: Are there many substitutes available?
- Information Access: Do buyers know the costs and quality of competitors?
- Switching Costs: Is it easy for buyers to leave?
Strategic Implications:
- If buyer power is High, focus on loyalty programs, customization, or service value.
- If buyer power is Low, you have more pricing freedom and can focus on volume.
4️⃣ Threat of Substitute Products
Substitutes are products from outside the industry that fulfill the same need. They place a ceiling on prices. For example, video conferencing substitutes for business travel.
Key Factors to Consider:
- Performance: Do substitutes offer better value or features?
- Price: Are substitutes cheaper to produce or buy?
- Switching Cost: How difficult is it for customers to switch to the alternative?
- Perceived Value: Do customers view the substitute as equally good?
Strategic Implications:
- If substitute threat is High, innovate continuously to stay ahead of alternatives.
- If substitute threat is Low, focus on brand differentiation to reinforce loyalty.
5️⃣ Rivalry Among Existing Competitors
This is the core of industry competition. It looks at how aggressively current players fight for market share. High rivalry leads to price wars and reduced margins.
Key Factors to Consider:
- Number of Competitors: Is the market fragmented or dominated by a few?
- Industry Growth: Is the market growing slowly, leading to a fight for share?
- Product Differentiation: Are products identical or distinct?
- Exit Barriers: Is it hard to leave the industry (e.g., specialized assets)?
- Capacity Increases: Are competitors adding capacity aggressively?
Strategic Implications:
- If rivalry is High, focus on cost leadership or niche differentiation.
- If rivalry is Low, opportunities exist for consolidation or premium positioning.
📊 Comparative Analysis of Force Drivers
The following table summarizes the primary drivers for each force to assist in your data gathering process.
| Force | Primary Driver | Indicator of High Power | Strategic Response |
|---|---|---|---|
| Threat of Entrants | Barriers to Entry | Low Capital, Low Regulation | Build Moats, Scale |
| Supplier Power | Supply Concentration | Few Suppliers, Unique Inputs | Diversify, Integrate |
| Buyer Power | Market Concentration | Few Buyers, Low Switching Costs | Add Value, Lock-in |
| Substitute Threat | Performance/Cost Ratio | Better/ Cheaper Alternatives | Innovate, Differentiate |
| Rivalry | Market Growth | Slow Growth, High Fixed Costs | Cost Leadership, Niche |
🛠️ Step-by-Step Implementation Guide
Applying this framework requires a structured approach. Follow these steps to conduct a thorough analysis.
Step 1: Define the Industry
Clearly define the boundaries of the industry you are analyzing. Is it “smartphones” or “mobile communication devices”? Broad definitions may obscure specific threats. Narrow definitions may miss emerging substitutes.
- Identify the core product or service.
- List the primary customer segments.
- Identify the geographic scope.
Step 2: Gather Data
Collect quantitative and qualitative data for each of the five forces. This involves market research, financial analysis, and stakeholder interviews.
- Market Reports: Look for industry growth rates and concentration ratios.
- Supplier Contracts: Review terms and pricing history.
- Customer Feedback: Understand pain points and switching reasons.
- Competitor Intel: Analyze marketing spend and product launches.
Step 3: Assess the Forces
Score each force as High, Medium, or Low. Use a weighted scoring system if necessary to prioritize threats. Be objective and avoid bias toward the current business model.
- Assign a score based on the factors listed in the previous sections.
- Document the evidence supporting each score.
- Identify which force has the most significant impact on profitability.
Step 4: Develop Strategic Responses
Once the analysis is complete, translate findings into action. Do not just identify problems; propose solutions.
- For High Threats: Mitigate risk through defensive strategies.
- For Low Threats: Exploit opportunities for growth.
- For Rivalry: Consider differentiation to escape price wars.
Step 5: Monitor and Update
Industries are dynamic. A force that is low today might be high in two years. Schedule regular reviews of the analysis.
- Review annually or upon major market shifts.
- Track regulatory changes that affect barriers to entry.
- Watch for technological disruptions that create new substitutes.
⚠️ Common Pitfalls to Avoid
Even experienced strategists make mistakes when applying this model. Awareness of these errors ensures more accurate results.
- Ignoring Complements: Products that enhance your own value (like apps for phones) are often overlooked but crucial.
- Focusing Only on Price: Competition is not just about price; it is about value, service, and innovation.
- Static Analysis: Assuming the industry structure remains constant over time.
- Internal Bias: Focusing too much on internal strengths rather than external threats.
- Vague Definitions: Defining the industry too broadly, which dilutes the analysis.
🧩 Integrating with Other Frameworks
The Five Forces Model works best when combined with other strategic tools. It provides the external context for internal planning.
- SWOT Analysis: Use Five Forces to define Opportunities and Threats. Use internal analysis for Strengths and Weaknesses.
- PESTLE Analysis: Use PESTLE for macro-environmental factors (Political, Economic, Social, Technological, Legal, Environmental) that influence the Five Forces.
- VRIO Framework: Assess if internal resources can provide a sustainable advantage against the identified external forces.
❓ Frequently Asked Questions
How often should I perform this analysis?
For most industries, an annual review is sufficient. However, in rapidly changing sectors like technology or healthcare, a quarterly review may be necessary to capture shifts in technology or regulation.
Can this model be used for non-profit organizations?
Yes. While the goal is often social impact rather than profit, the competitive dynamics still exist. For example, a charity might compete with other charities for donor funds (Buyer Power) or government grants (Supplier Power).
What if the forces seem contradictory?
This is common. One force might indicate a profitable industry while another suggests high risk. The goal is to find the net effect. Prioritize the forces that have the highest impact on your specific cost structure and revenue model.
Does this model work for digital platforms?
It applies, but with adjustments. Network effects often lower barriers to entry for users but raise them for competitors. Data ownership can act as a barrier to entry. Substitute threats are often higher in digital spaces due to low switching costs.
How do I measure “Rivalry” quantitatively?
Use metrics such as the Herfindahl-Hirschman Index (HHI) to measure market concentration. Look at price elasticity of demand and the rate of price changes in the market. High frequency of price wars indicates high rivalry.
🎯 Final Thoughts on Execution
Applying the Porter’s Five Forces Model is not a one-time exercise. It is a mindset for understanding the competitive landscape. By systematically evaluating the threats from entrants, suppliers, buyers, substitutes, and rivals, you gain clarity on where value is created and where it is eroded.
Success in strategy comes from aligning internal capabilities with external realities. Use this framework to guide your decision-making process. Ensure that your teams understand the dynamics at play. When everyone sees the same competitive structure, strategic alignment becomes easier.
Start your analysis today. Gather your data, map the forces, and identify the strategic moves that will secure your position in the market. The clarity you gain will inform your roadmap for the next fiscal year and beyond.


Comments (0)