Tags:
Troubleshooting Your Five Forces Analysis: When Things Go Wrong
Strategic planning relies heavily on accurate data and sound logic. When you apply Michael Porter’s Five Forces framework, the goal is to understand the competitive intensity and attractiveness of a market. However, even the most experienced strategists encounter stumbling blocks. Missteps here can lead to misguided investments, missed opportunities, or exposure to threats that were previously invisible. This guide provides a deep dive into the common errors that plague industry analysis and offers concrete steps to identify and correct them. We will explore where the framework breaks down, how to validate your findings, and what to do when the numbers simply do not add up. 📉
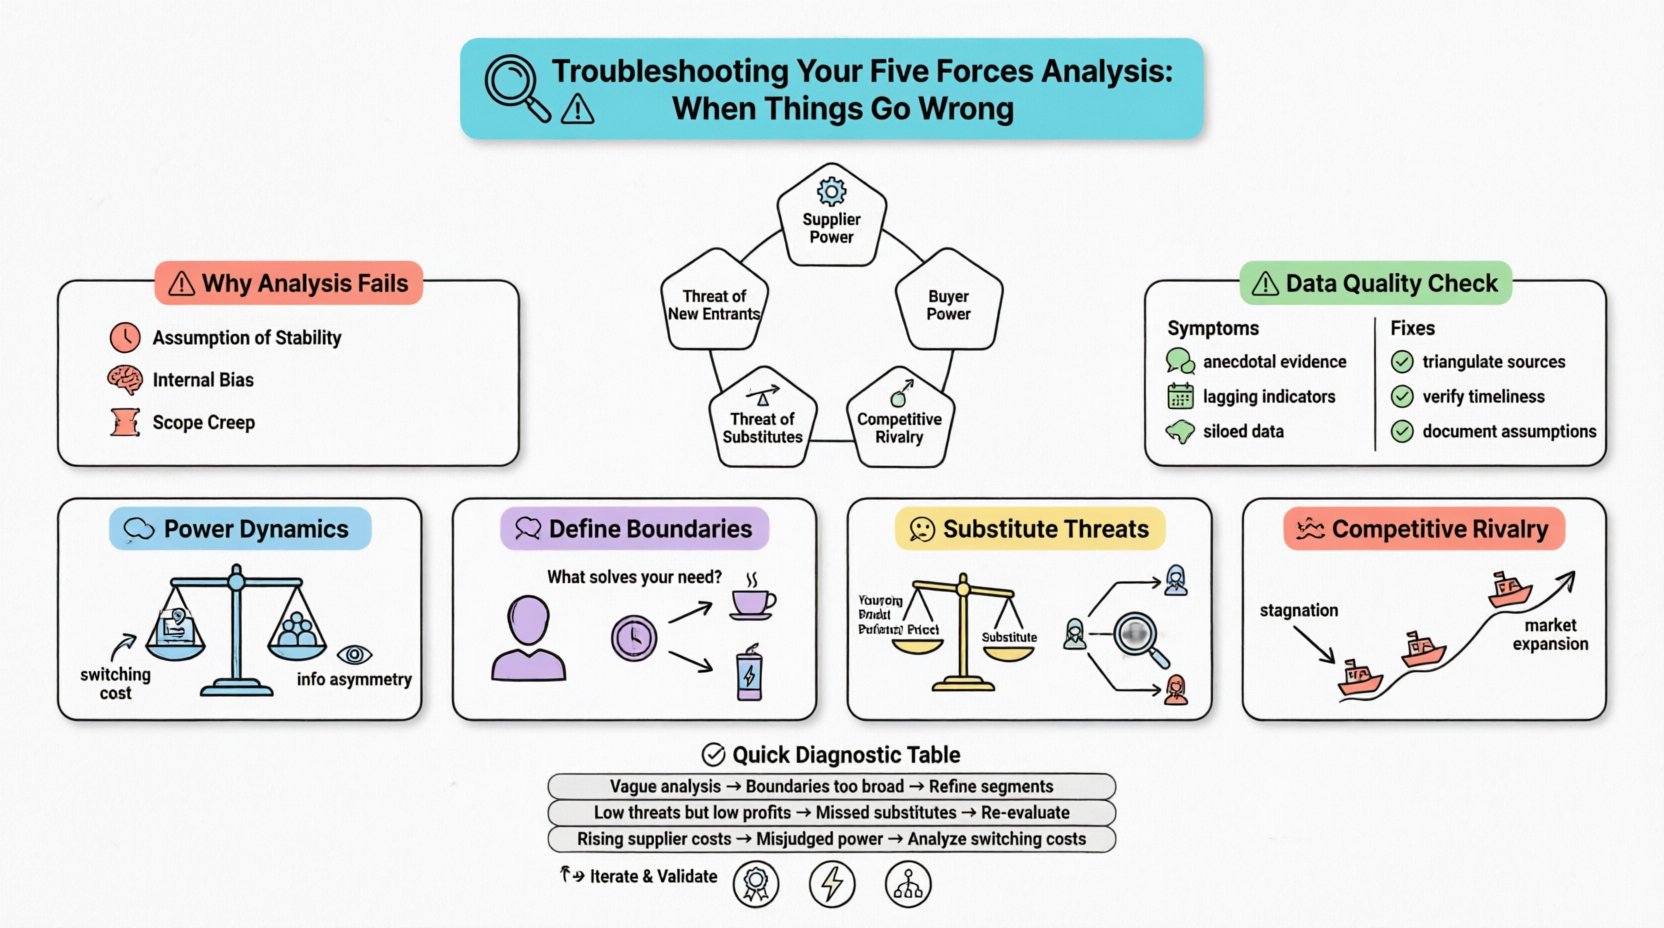
Understanding Why Analysis Fails 🧐
A flawed Five Forces Analysis is often the result of assuming the framework is a static checklist rather than a dynamic diagnostic tool. It is easy to treat the five categories as isolated silos, ignoring the interconnected nature of the forces. When an analysis goes wrong, it is usually due to one of three core issues: poor data quality, incorrect boundary definitions, or a failure to account for external shifts.
Without troubleshooting these root causes, the strategic output becomes unreliable. You might think you are safe from competition when you are actually walking into a trap. Let’s break down the specific symptoms of a failing analysis and how to address them.
- Assumption of Stability: Markets are fluid. A static view of current conditions misses emerging trends.
- Internal Bias: Teams often see what they want to see, confirming pre-existing beliefs rather than challenging them.
- Scope Creep: Trying to analyze too much industry detail dilutes the focus on the most critical competitive pressures.
The Data Foundation: Information Quality Issues 📉
The integrity of your Five Forces model depends entirely on the quality of the input. If the data is outdated, biased, or incomplete, the output will inevitably be flawed. This is the most common source of error in strategic planning.
Symptoms of Bad Data
When reviewing your analysis, look for these warning signs regarding data quality:
- Reliance on Anecdotal Evidence: Are your conclusions based on a single conversation with a supplier or a recent news article? Generalizing from small samples is risky.
- Lagging Indicators: Are you using financial reports from last year to predict market dynamics for next year? Financials are historical; strategy is forward-looking.
- Internal Data Silos: Are you relying solely on marketing data while ignoring operations or R&D insights? A holistic view requires cross-functional input.
Corrective Actions
To ensure your data foundation is solid, you must diversify your sources. Combine quantitative market research with qualitative interviews.
- Triangulate Sources: Cross-reference industry reports with primary data from customers and suppliers.
- Verify Timeliness: Ensure all data points are less than 12 months old, or clearly mark them as historical baselines.
- Document Assumptions: If you must make an assumption due to missing data, document it explicitly. This allows you to revisit and adjust the analysis later if new information becomes available.
Defining Industry Boundaries Incorrectly 🚧
One of the most frequent mistakes is defining the industry too narrowly or too broadly. If the boundary is too narrow, you miss substitute threats. If it is too broad, the competitive intensity appears lower than it actually is.
Example of Boundary Error
Consider a company producing premium coffee beans. If they define their industry strictly as “Premium Coffee Beans,” they might ignore the threat of ready-to-drink cold brews or energy drinks. However, if they define it as “Beverages,” the competitive landscape becomes so vast that no clear strategy emerges.
How to Refine Your Boundaries
Use the customer’s perspective to define the boundary, not your internal product code.
- Ask the Customer: What other products do they use to solve the same problem? If they need caffeine, do they only look at coffee beans, or do they consider tea, soda, or pills?
- Identify Substitutes Early: A substitute product solves the same need in a different way. Failing to identify this leads to underestimating the threat.
- Adjust for Substitution: If a substitute is gaining market share, the industry boundary effectively expands to include that substitute.
The Substitute Threat Misjudgment 👻
Substitutes are often the hidden killers in a Five Forces Analysis. They do not compete on price or features directly; they compete on convenience, price, or a completely different solution to the same problem. When things go wrong here, companies are blindsided by disruptive innovations.
Common Errors in Substitution Analysis
- Ignoring Price Sensitivity: You might focus on product features, but if a substitute is 50% cheaper, features matter less to the price-sensitive buyer.
- Overlooking Switching Costs: High switching costs protect incumbents, but if the substitute offers a massive value jump, customers will pay the cost to switch anyway.
- Dismissing Low-Tech Solutions: Don’t assume the threat is high-tech. A simple, low-tech solution can disrupt a high-tech industry if it is significantly easier to use.
Validating Substitute Threats
To troubleshoot this force, perform a functional analysis.
- Map the User Journey: Where does the customer go before they buy your product? What alternatives do they consider?
- Monitor Trend Lines: Is the market share of the substitute growing even if your product remains stable? This indicates a shift in preference.
- Assess Performance-to-Price: Calculate the performance-per-dollar of your product versus the substitute. If the substitute wins on value, the threat is high.
Supplier and Buyer Power Dynamics 🤝
The bargaining power of suppliers and buyers is often misjudged because it is assumed to be static. In reality, these powers shift based on market concentration, standardization, and vertical integration.
Supplier Power Pitfalls
Many organizations believe they have low supplier power because they have multiple vendors. This is not always true.
- Specialized Inputs: If your suppliers provide a highly specialized component that is hard to replicate, they hold power regardless of the number of vendors.
- Switching Costs: If changing suppliers requires significant retooling or certification, your bargaining power is low.
- Threat of Forward Integration: Does the supplier have the ability to become your competitor? If yes, their power is significantly higher.
Buyer Power Pitfalls
Buyers are not always powerful. Sometimes, they are fragmented or lack information.
- Fragmentation: If buyers are small and numerous, they have less collective power than a single large enterprise client.
- Information Asymmetry: If your buyers do not know the true market price, they cannot bargain effectively.
- Volume Importance: If your product is a small percentage of the buyer’s total costs, their power over you is diminished.
Competitive Rivalry: The Red Ocean 🌊
Rivalry is the most visible force. It is often the easiest to measure but the hardest to interpret correctly. High rivalry is often assumed to be bad, but in some cases, it indicates a healthy, growing market.
Why Rivalry Analysis Fails
- Focusing Only on Price: Competition is not just about discounting. It is about innovation, service, brand, and speed.
- Ignoring the Slow Players: Not all competitors are active. Some are dormant or repositioning. Their inactivity can be just as strategic as their activity.
- Overlooking Market Growth: In a rapidly growing market, rivalry is lower because there is enough room for everyone. In a stagnant market, rivalry intensifies as players fight for market share.
Corrective Steps for Rivalry
To get a clear picture of rivalry, look beyond the immediate competitors.
- Map Competitor Strategies: Are they all chasing the same customer segment? Or are they differentiated?
- Analyze Exit Barriers: High exit barriers (like specialized assets or emotional attachment) force companies to stay and fight even if profits are low. This increases rivalry.
- Monitor Capacity Utilization: If industry capacity is high and demand is low, price wars become likely. This is a key indicator of intense rivalry.
Common Pitfalls and Diagnostic Table ⚠️
To help you quickly identify where your analysis might be broken, refer to this diagnostic table. It matches common symptoms with potential root causes and recommended fixes.
| Symptom | Potential Cause | Corrective Action |
|---|---|---|
| Analysis feels too vague | Industry boundaries are too broad | Refine focus to specific segments or geographies |
| Threats seem low but profits are low | Substitutes or new entrants are underestimated | Re-evaluate substitute products and entry barriers |
| Supplier costs are rising unexpectedly | Supplier power was misjudged | Analyze switching costs and supplier concentration |
| Customer churn is high | Buyer power or switching costs are low | Investigate value proposition and loyalty mechanisms |
| Competitor moves are unpredictable | Competitor goals are unknown | Conduct competitor profiling on objectives and capabilities |
| Results contradict market reality | Data is outdated or biased | Refresh data sources and validate with external experts |
Iterating and Validating Results 🔄
A Five Forces Analysis is not a one-time event. It is a living document that must evolve as the market changes. When things go wrong, the first step is to admit the analysis needs iteration.
Validation Techniques
Use external validation to ensure your internal logic holds up.
- Third-Party Review: Have an industry expert who is not involved in the project review the findings. They can spot biases you miss.
- Stress Testing: Ask “What if” questions. What if a new regulation passes? What if a major supplier goes bankrupt? Does the strategy still hold?
- Scenario Planning: Develop multiple scenarios based on different force strengths. This prepares you for volatility rather than relying on a single forecast.
Strategic Implications of Flawed Data 🎯
Why does this matter? Because bad analysis leads to bad strategy. If you underestimate the threat of new entrants, you might fail to invest in your own barriers. If you overestimate supplier power, you might miss out on vertical integration opportunities.
Consequences of Error
- Capital Misallocation: Investing in the wrong areas based on incorrect force assessments.
- Missed Opportunities: Ignoring a growing segment because it was classified as “low power” incorrectly.
- Defensive Failure: Being caught off guard by a competitive move that was actually predicted by a more accurate analysis.
Moving Forward with Confidence 🚀
When you troubleshoot your Five Forces Analysis, you are not just fixing numbers; you are refining your understanding of the competitive landscape. The framework is a tool for thinking, not a calculator for truth. By acknowledging the limitations of data, defining boundaries carefully, and continuously validating your findings, you can turn a flawed analysis into a robust strategic asset.
Keep the data fresh, challenge your assumptions, and remember that the goal is clarity, not perfection. A clear understanding of the forces at play, even if imperfect, is better than a confident guess based on incomplete information. Use these troubleshooting steps to strengthen your strategic planning process and ensure your decisions are grounded in reality. 🛡️


Comments (0)