C4 Model for Cloud-Native Systems: Visualizing Microservices and Services
Modern software architecture is complex. As systems evolve from monolithic structures to distributed cloud-native environments, understanding the relationships between components becomes critical. The C4 Model offers a structured approach to software architecture documentation. It helps teams visualize systems at multiple levels of abstraction. This guide explores how to apply the C4 Model specifically to cloud-native systems and microservices architecture.
📉 Architecture diagrams often become outdated quickly. Without a standardized model, documentation drifts away from reality. The C4 Model addresses this by providing a hierarchy of diagrams. Each level serves a specific audience and purpose. Whether you are a developer, an architect, or a stakeholder, there is a view designed for you.
🤔 Why Cloud-Native Systems Need Better Visualization
Cloud-native systems introduce unique challenges compared to traditional deployments. Services are distributed across multiple nodes. They communicate over networks. They scale independently. These characteristics make static, monolithic diagrams insufficient.
When building microservices, teams face the following challenges:
- Distributed Complexity: Understanding how data flows across multiple services requires a clear map.
- Bounded Contexts: Defining where one service ends and another begins is crucial for maintainability.
- Integration Points: APIs, message queues, and databases connect various parts of the system.
- Deployment Topology: Knowing where containers run helps in debugging performance issues.
Without a standardized visualization method, these complexities lead to confusion. Developers spend more time guessing than coding. The C4 Model provides a common language to discuss these structures.
📊 The C4 Hierarchy Explained
The C4 Model consists of four levels. Each level zooms in on the system. The hierarchy moves from the big picture down to the implementation details. This section breaks down each level with a focus on cloud-native contexts.
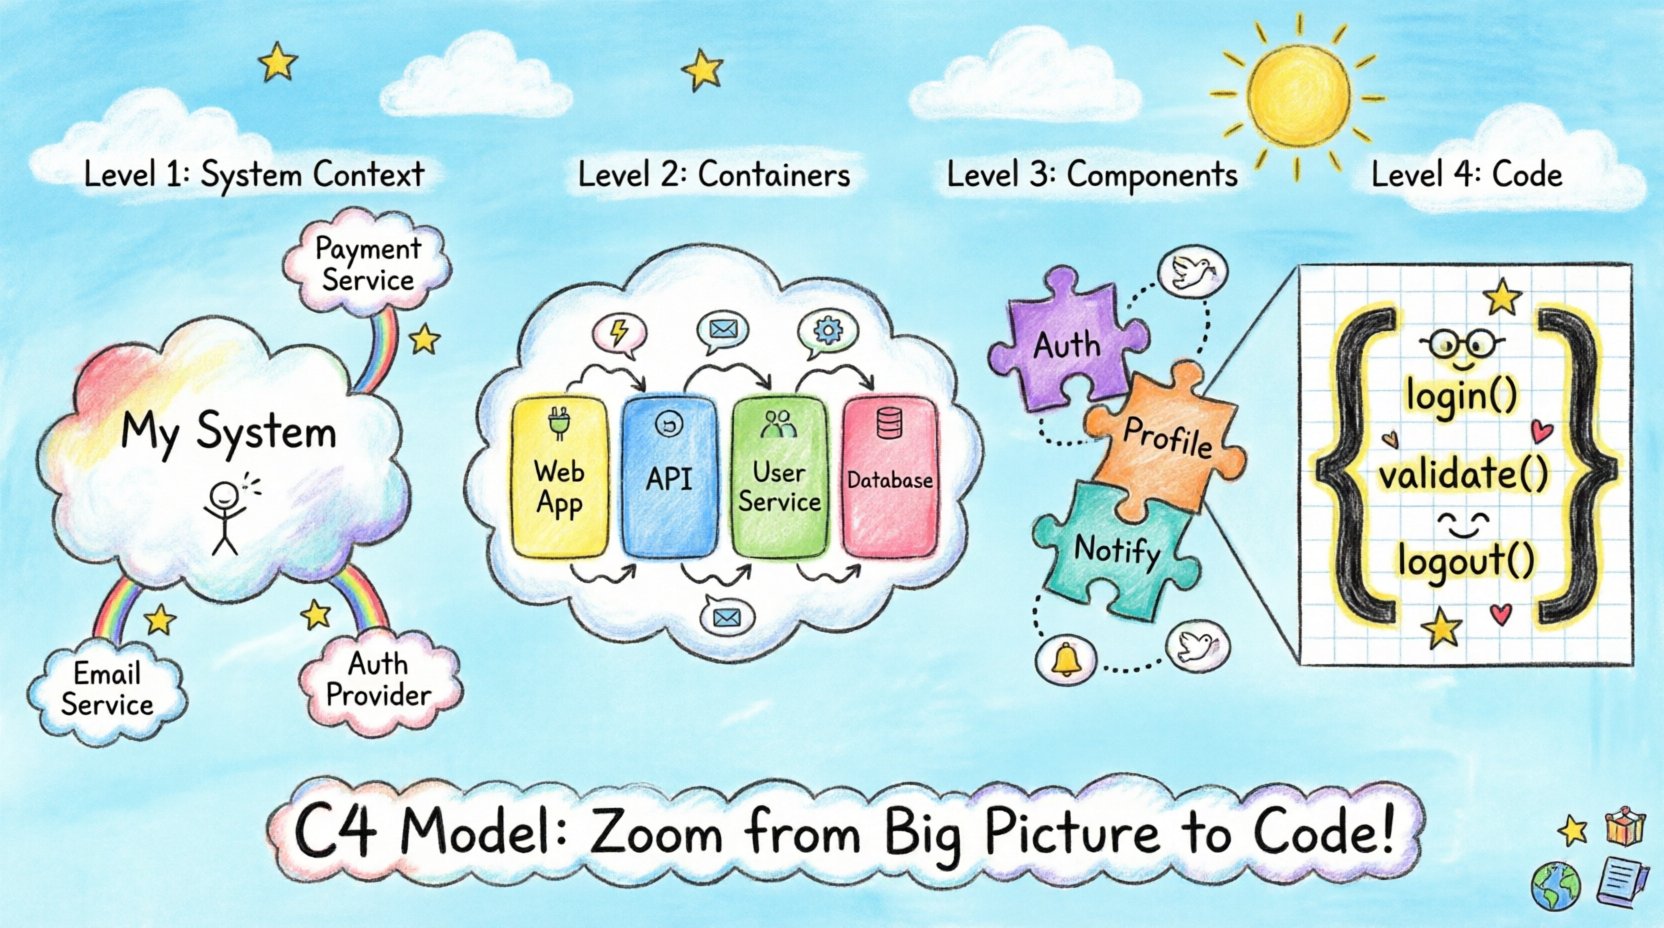
1️⃣ Level 1: System Context Diagram (🌍)
The System Context diagram provides the highest level of abstraction. It shows the software system as a single box. It also shows the people and systems that interact with it.
Key Elements:
- System Box: Represents the entire application.
- People: Users, administrators, or external actors.
- Software Systems: External services like payment gateways, email providers, or third-party APIs.
- Relationships: Lines showing data flow or interaction.
In a cloud-native environment, this diagram helps identify dependencies. It answers the question: “Who talks to this system?” This is vital for understanding security boundaries and external integrations.
2️⃣ Level 2: Container Diagram (📦)
The Container diagram zooms into the system box. It breaks the system into high-level building blocks. These blocks are called containers. In this context, a container is not necessarily a Docker container. It refers to a deployable unit of software.
Key Elements:
- Containers: Web applications, mobile apps, microservices, databases, batch jobs, or data warehouses.
- Relationships: Communication protocols (HTTP, gRPC, TCP) between containers.
- Storage: Persistent data stores associated with containers.
For microservices, this is the most critical diagram. It defines the services that exist. It clarifies the boundaries of each microservice. It shows how services talk to each other. For example, an API Gateway might route requests to a User Service and an Order Service.
3️⃣ Level 3: Component Diagram (🧩)
The Component diagram zooms into a specific container. It shows the internal structure of that container. It breaks the container down into components. Components are logical groupings of functionality.
Key Elements:
- Components: Classes, modules, packages, or subsystems within the container.
- Relationships: Dependencies and interactions between components.
- Interfaces: How components expose functionality to others.
This level helps developers understand the internal organization of a microservice. It prevents the “spaghetti code” anti-pattern. It shows which components handle authentication versus which handle business logic. It is useful for onboarding new team members to a specific service.
4️⃣ Level 4: Code Diagram (📝)
The Code diagram shows the implementation details. It maps directly to the source code. It displays classes, methods, and attributes.
Key Elements:
- Classes: Specific code structures.
- Methods: Functions and operations.
- Attributes: Data properties.
In modern architecture, this level is often generated from code automatically. It is useful for deep debugging or understanding specific logic flows. However, it is rarely used for high-level architectural planning.
🔍 Comparing the C4 Levels
To clarify the differences between levels, refer to the table below. It summarizes the focus, audience, and granularity for each diagram type.
| Level | Name | Focus | Audience | Granularity |
|---|---|---|---|---|
| 1 | System Context | External interactions | Stakeholders, Managers | High (System as a block) |
| 2 | Container | Technical boundaries | Developers, Architects | Medium (Services/Apps) |
| 3 | Component | Internal logic | Developers, Team Leads | Low (Modules/Functions) |
| 4 | Code | Implementation | Developers | Very Low (Classes/Methods) |
🚀 Applying C4 to Microservices Architecture
Microservices architecture requires clear boundaries. The C4 Model supports this by enforcing a separation of concerns. When designing cloud-native systems, follow these steps to create effective diagrams.
Step 1: Define the System Context
Start by identifying the system name. Draw a single box. Add external users and systems. This sets the stage. It defines the scope of the project. For a cloud-native system, include:
- Cloud providers (e.g., AWS, Azure, GCP) as external systems if relevant.
- Identity providers (e.g., OAuth servers).
- Customer-facing portals.
Step 2: Identify Containers
Break the system into containers. A container is a cohesive unit of deployment. In microservices, each service is often a container. Identify the following:
- Frontend: Web application or mobile app.
- Backend Services: REST APIs, GraphQL APIs, or gRPC services.
- Data Stores: Databases, caches, or message brokers.
- Infrastructure: Load balancers or API gateways.
Ensure each container has a clear responsibility. Avoid creating containers that do too many things. This is the “Single Responsibility Principle” applied to architecture.
Step 3: Detail Components
Drill down into specific services. A user service might have these components:
- Authentication Module: Handles login and sessions.
- User Profile Module: Manages user data.
- Notification Module: Sends emails or push notifications.
Document the interfaces between these components. This helps in understanding coupling. Tight coupling between components makes the system harder to maintain.
Step 4: Map Data Flows
Arrows in diagrams represent data flow. They are critical for understanding how information moves. In cloud-native systems, data flow can be synchronous or asynchronous.
- Synchronous: HTTP requests, gRPC calls. The caller waits for a response.
- Asynchronous: Message queues, event streams. The caller sends a message and continues.
Clearly label these flows. Specify the protocol used. This helps in troubleshooting latency issues later.
⚙️ Best Practices for Maintenance
Diagrams are only useful if they are accurate. Outdated diagrams cause more harm than no diagrams at all. Here are strategies to keep documentation current.
1. Treat Diagrams as Code
Store diagram definitions in version control. This allows you to track changes over time. It enables code review processes for architecture changes. Many tools support generating diagrams from text files.
2. Integrate with CI/CD
Automate the generation of diagrams. When code changes, the diagram should update. This ensures the documentation always reflects the current state. Automated pipelines can build the diagrams and publish them to a wiki or documentation site.
3. Keep It Simple
Do not try to draw every single class. Focus on the architectural elements. If a diagram becomes too crowded, it loses its value. Use annotations to explain complex logic instead of drawing every detail.
4. Define Naming Conventions
Use consistent names for containers and components. If a service is called “User Service” in the diagram, it should match the repository name. Consistency reduces cognitive load for readers.
⚠️ Common Pitfalls to Avoid
Even with a good model, mistakes happen. Be aware of these common issues when visualizing cloud-native systems.
- Over-Engineering: Creating diagrams for every single feature. Focus on the architecture, not the features.
- Ignoring Cloud Specifics: Treating cloud services like on-premise servers. Cloud-native systems rely on managed services which change the topology.
- Static Diagrams: Creating a diagram once and never updating it. Architecture evolves as the system grows.
- Confusing Container and Component: A microservice is a container. The classes inside it are components. Do not mix these levels.
🤝 Collaboration and Team Alignment
Architecture is a team effort. The C4 Model facilitates communication across different roles.
For Product Owners
Use the System Context diagram. It shows business value. It explains how the system interacts with the real world. It helps in planning roadmaps and identifying dependencies.
For Developers
Use the Container and Component diagrams. They provide the technical blueprint. They help in designing new features without breaking existing ones. They clarify ownership of specific parts of the codebase.
For Operations
Use the Container diagram with a focus on infrastructure. It shows where services run. It highlights data stores and network dependencies. This aids in capacity planning and disaster recovery.
📈 Scaling the C4 Model
As systems grow, the number of diagrams increases. Managing this growth is important. Consider the following strategies for large-scale organizations.
- Architecture Decision Records (ADRs): Document the “why” behind major decisions alongside the diagrams.
- Domain-Driven Design (DDD): Align the C4 containers with bounded contexts. This ensures the diagram matches the business domain.
- Tooling Standards: Agree on a standard set of tools across the organization. This ensures diagrams look consistent regardless of who created them.
🛠️ Implementation Considerations
When setting up a C4 workflow, consider the tools available. You do not need expensive software. Open-source solutions and code-based approaches work well.
Text-Based Diagramming
Writing diagrams in text is often easier than using drag-and-drop interfaces. It allows for version control. It enables automation. Many developers prefer this for long-term maintenance.
Visual Editors
Some teams prefer visual interfaces for initial brainstorming. These tools can be valuable for workshops. However, ensure the output can be version-controlled. Avoid proprietary formats that lock you into a specific vendor.
Code Generation
Advanced setups can generate diagrams from code annotations. This keeps the diagram in sync with the source. It reduces manual effort. It requires an investment in tooling configuration.
🌐 The Future of Architecture Documentation
Architecture documentation is evolving. As systems become more dynamic, static diagrams may need to become interactive. Future tools might allow real-time visualization of running systems. The C4 Model provides a stable foundation for this evolution. Its levels remain relevant regardless of the technology stack.
The goal is clarity. Clear diagrams lead to better decisions. They reduce risk. They speed up onboarding. They help teams ship software with confidence. By adhering to the C4 Model, teams can navigate the complexity of cloud-native systems effectively.
📝 Summary of Key Takeaways
- The C4 Model offers four levels of abstraction: System Context, Container, Component, and Code.
- Cloud-native systems benefit from clear container definitions to manage microservices.
- Maintain diagrams as code to ensure accuracy over time.
- Avoid over-complicating diagrams; focus on architectural boundaries.
- Use the appropriate level for your audience (Stakeholders vs. Developers).
- Integrate diagram generation into your development pipeline.
By following these principles, you can build a documentation strategy that supports growth. The C4 Model is not just about drawing boxes. It is about thinking clearly about how software is built. It brings structure to chaos. It turns complexity into clarity.


Comments (0)