C4 Model and Documentation: Creating Living Architectural Artifacts
Software architecture is the backbone of any robust system. It dictates how components interact, how data flows, and how the system scales. Yet, too often, this critical knowledge sits in static documents that gather dust or, worse, become outdated the moment the code changes. The C4 Model offers a structured approach to visualizing software architecture at different levels of abstraction. By adopting this model, teams can create documentation that remains relevant, useful, and aligned with the evolving codebase.
This guide explores how to implement the C4 Model effectively. We will examine the four levels of abstraction, discuss strategies for maintaining living artifacts, and outline best practices for collaboration. The goal is to move away from documentation as a compliance exercise and toward documentation as a tool for communication and clarity.
📐 Understanding the C4 Hierarchy
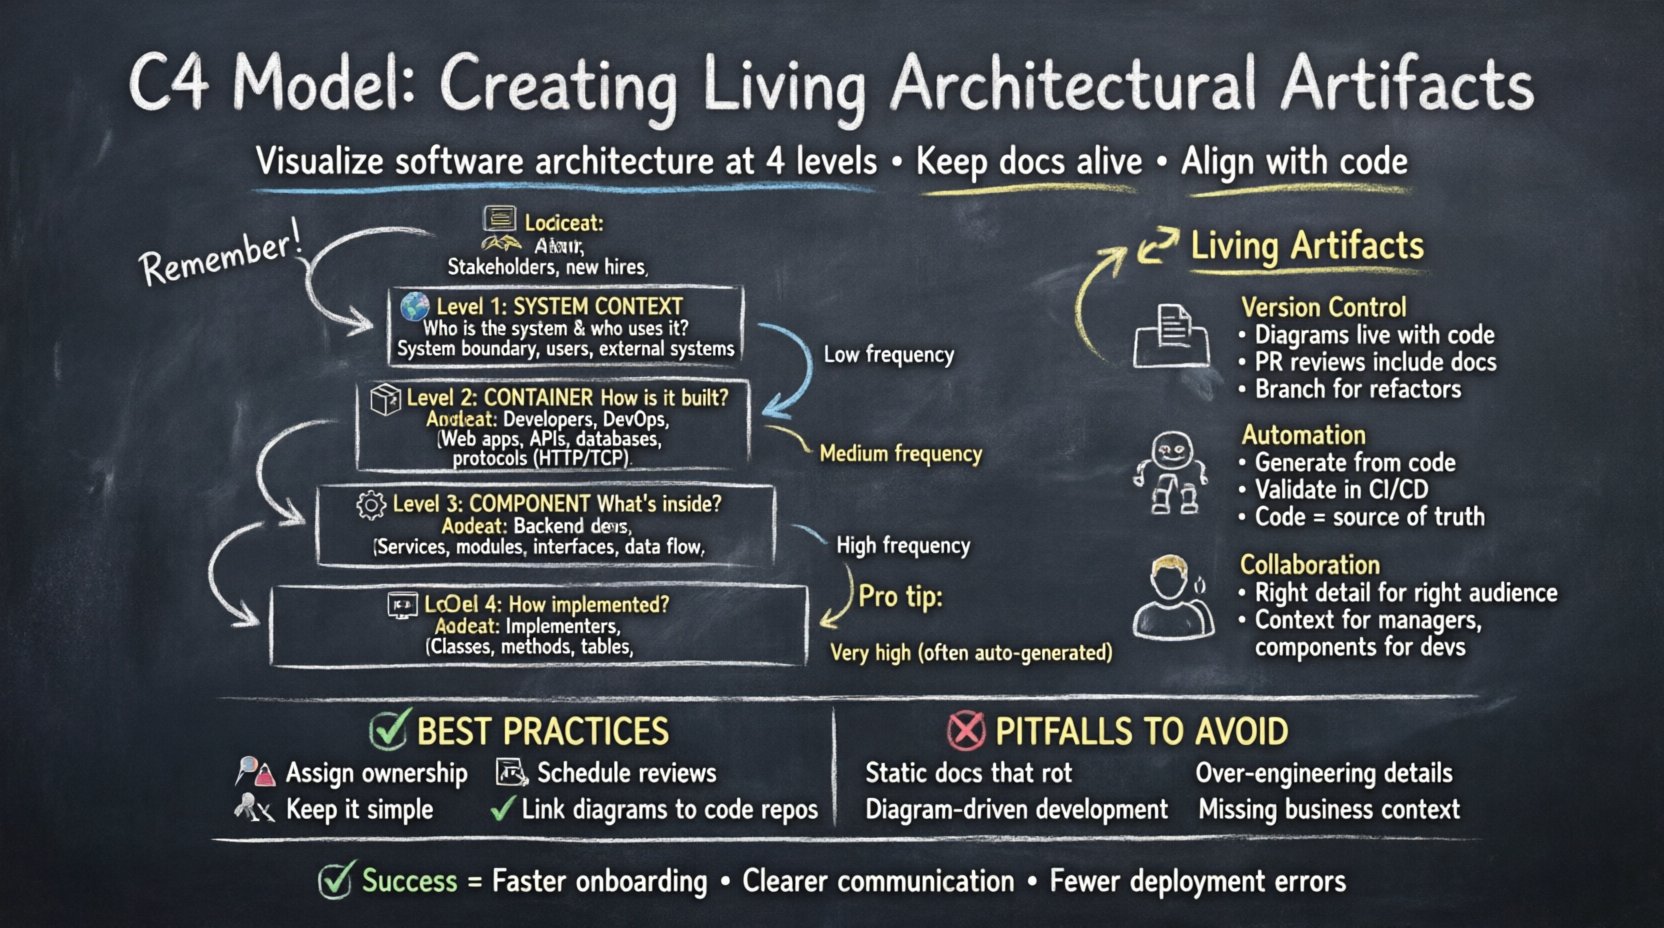
The C4 Model organizes architecture diagrams into four distinct levels. Each level serves a specific audience and answers a specific set of questions. Moving from high-level context to low-level detail allows stakeholders to grasp the system without being overwhelmed by implementation specifics.
1. System Context Diagram 🌍
The System Context diagram provides the highest level of abstraction. It answers the question: “What is the system, and who interacts with it?” This diagram is essential for new hires, product managers, and external stakeholders who need a quick overview of the software’s place within the broader ecosystem.
- Primary Audience: Non-technical stakeholders, new team members, management.
- Key Elements: The software system itself, external users, and other systems it communicates with.
- Details: Relationships are shown as simple lines. Labels indicate the nature of the interaction (e.g., “Manages orders”, “Provides authentication”).
This diagram should fit on a single page. If it requires more space, the scope is likely too broad. It defines the boundary of the system clearly, separating what is inside from what is outside.
2. Container Diagram 📦
The Container diagram breaks the system down into its major building blocks. Containers represent deployable units, such as web applications, mobile apps, microservices, or databases. This level answers: “How is the system built and what technologies are used?”
- Primary Audience: Developers, DevOps engineers, technical architects.
- Key Elements: Web servers, API gateways, databases, third-party services.
- Details: Shows how containers communicate with each other using specific protocols (HTTP, TCP, etc.).
Unlike the context diagram, this level focuses on the internal structure of the system. It helps developers understand where to deploy code and how to manage dependencies between different runtime environments.
3. Component Diagram ⚙️
The Component diagram zooms in further to show the internal structure of a single container. It answers: “What are the major software components inside this container?” This is where the logic of the application begins to take shape.
- Primary Audience: Backend developers, system designers.
- Key Elements: Services, modules, libraries, data access layers.
- Details: Interfaces are shown explicitly. This diagram clarifies how data moves between internal parts of a service.
A component is a logical grouping of functionality, not necessarily a physical file. It represents a cohesive unit of work that can be developed and tested independently within the container.
4. Code Diagram 💻
The Code diagram is the lowest level of abstraction. It typically maps to a specific class or method structure. However, in the C4 Model, this level is often omitted unless necessary. It answers: “How is this component implemented?”
- Primary Audience: Developers working on specific features.
- Key Elements: Classes, methods, database tables.
- Details: Shows relationships like inheritance, composition, and association.
Because code changes frequently, maintaining this level of detail in a diagram is often impractical. Many teams find that code documentation or inline comments serve this purpose better than static diagrams.
🔄 Creating Living Architectural Artifacts
A common failure in software documentation is the disconnect between the diagram and the code. When a diagram is created once and never updated, it becomes misleading. To create living artifacts, the documentation process must be integrated into the daily workflow.
Integrating with Version Control
Diagrams should reside in the same version control system as the source code. This ensures that any change to the architecture is tracked alongside the change to the code. When a Pull Request modifies a service, the diagram update should be part of the same commit or closely linked.
- Commit History: Reviewing the commit history of a diagram file reveals how the architecture has evolved over time.
- Review Process: Diagram changes should be reviewed by peers just like code changes.
- Branching: Create branches for significant architectural refactors to discuss the changes before merging.
Automated Generation and Validation
Manual maintenance is prone to error. Where possible, use tools that can generate diagrams from code or configuration files. This reduces the gap between the reality of the system and its representation.
- Source of Truth: Let the code be the primary source of truth. Diagrams should reflect the code, not dictate it.
- Validation: Automated checks can alert the team if a diagram diverges significantly from the deployed infrastructure.
- CI/CD Integration: Include diagram generation in the build pipeline to ensure artifacts are always up to date.
👥 Collaboration and Audience Targeting
Different stakeholders consume information differently. A single diagram rarely satisfies everyone. The C4 Model excels here because it segments the information by complexity.
| Diagram Level | Primary Audience | Key Question Answered | Update Frequency |
|---|---|---|---|
| System Context | Stakeholders, Product Managers | What does the system do? | Low (Major Releases) |
| Container | Developers, DevOps | How is it built? | Medium (Feature Changes) |
| Component | Core Developers | How does logic flow? | High (Refactors) |
| Code | Implementers | How is it implemented? | Very High (Code Changes) |
By aligning the diagram level with the audience, you ensure that information is accessible without being overwhelming. A product manager does not need to see database tables, just as a developer does not need to see the high-level business scope for every task.
🛡️ Best Practices for Maintenance
Maintaining documentation requires discipline. Without a defined process, it will degrade over time. Here are strategies to keep artifacts current.
1. Assign Ownership
Every diagram or set of diagrams should have an owner. This person is responsible for ensuring the documentation remains accurate. Ownership prevents the “everyone’s responsibility means no one’s responsibility” scenario.
2. Schedule Regular Reviews
Set a recurring cadence for reviewing architecture documentation. This could be part of a sprint retro or a dedicated technical deep-dive session. During these reviews, ask:
- Has the system changed?
- Is the diagram still accurate?
- Is the level of detail appropriate?
3. Keep it Simple
Complex diagrams are hard to read and hard to maintain. Avoid clutter. Use color coding sparingly to highlight specific types of interactions, such as security boundaries or data flow directions. If a diagram looks busy, it likely contains too much information for its intended purpose.
4. Link to Source Code
Where diagrams represent components, link to the actual code repository. This allows readers to jump from the abstract concept to the implementation details instantly. This bridges the gap between design and execution.
⚠️ Common Pitfalls to Avoid
Even with the best intentions, teams often fall into traps that reduce the value of their documentation.
| Pitfall | Impact | Mitigation Strategy |
|---|---|---|
| Diagram Driven Development | Code is written to fit the diagram, ignoring actual requirements. | Treat diagrams as a record of the current state, not a blueprint for the future. |
| Over-Engineering | Too much detail makes the diagram unreadable. | Start with the Context diagram and only drill down if necessary. |
| Static Documentation | Docs become outdated quickly. | Integrate diagram updates into the deployment pipeline. |
| Missing Context | Stakeholders do not understand the business value. | Ensure the System Context diagram is prominent and accessible. |
🚀 Integrating into the SDLC
The software development life cycle (SDLC) is the framework within which architecture documentation exists. Integrating the C4 Model into this framework ensures consistency.
Design Phase
During the design phase, create the initial Context and Container diagrams. These serve as the agreement between the team and stakeholders on what will be built. Review these diagrams before writing any code. This early alignment saves time later when requirements need to be adjusted.
Implementation Phase
As features are developed, update the diagrams incrementally. Do not wait until the end of a project to update the architecture map. Small, frequent updates prevent the documentation debt from accumulating.
Review Phase
Include architecture diagrams in code review checklists. Reviewers should verify that the implementation matches the design. If the code diverges from the diagram, update the diagram to reflect reality.
📊 Measuring Success
How do you know if your documentation strategy is working? Look for indicators of engagement and utility.
- Onboarding Time: Does it take less time for new developers to understand the system?
- Communication Efficiency: Are meetings about architecture shorter because everyone is looking at the same diagram?
- Reduced Errors: Are there fewer deployment failures caused by misunderstandings of system boundaries?
- Active Usage: Are people actually viewing and referencing the diagrams in the documentation portal?
🛠️ Tooling Considerations
While specific tools should not dictate the model, choosing the right platform for creation and storage is vital. The tool should support the C4 notation and facilitate collaboration.
- Collaboration: Can multiple people edit or view the diagram simultaneously?
- Versioning: Does the tool support version history?
- Integration: Can it integrate with issue trackers or documentation hubs?
- Export: Can diagrams be exported in common formats for sharing?
The focus should remain on the content of the diagram, not the features of the tool. A simple text-based format that is version controlled is often better than a complex proprietary format that is difficult to maintain.
🌱 The Evolution of Documentation
Documentation is not a one-time task. It evolves as the software evolves. The C4 Model provides a framework for this evolution, allowing the documentation to grow in complexity without losing clarity. By starting high and drilling down only when needed, teams maintain a clear view of the system at any given moment.
Living artifacts require a cultural shift. They require the team to value understanding over speed. In the long run, the time spent maintaining accurate diagrams pays dividends in reduced technical debt, faster onboarding, and more reliable deployments.
🔍 Summary of Key Takeaways
To summarize the approach to C4 documentation:
- Use Levels: Leverage the four levels to target the right audience.
- Keep it Current: Treat diagrams as living code.
- Automate: Use tooling to reduce manual overhead.
- Review: Make diagram updates part of the standard workflow.
- Simplify: Avoid over-complicating the visual representation.
By following these principles, teams can create a documentation ecosystem that supports rather than hinders development. The architecture becomes a shared language, facilitating better decisions and stronger systems.


Comments (0)