How C4 Model Enables Better Communication Between Technical and Non-Technical Stakeholders
In the modern landscape of software development, the chasm between engineering teams and business stakeholders often leads to friction, misalignment, and delays. Engineers speak in syntax, architecture, and protocols, while business leaders focus on value, timelines, and market fit. Bridging this divide requires a shared visual language that abstracts complexity without losing critical detail. The C4 model provides exactly that framework.
This guide explores how implementing the C4 model transforms documentation from a static obligation into a dynamic communication tool. We will examine the layers of abstraction, how different roles interact with each diagram level, and practical strategies for maintaining alignment throughout the software lifecycle.
🌍 Understanding the C4 Model Structure
The C4 model is a hierarchy of diagrams designed to describe software architecture at different levels of detail. It was created to address the common problem where technical diagrams are either too vague to be useful or too granular to be understood by non-technical audiences. By organizing information into four distinct levels, the model allows stakeholders to zoom in and out as needed.
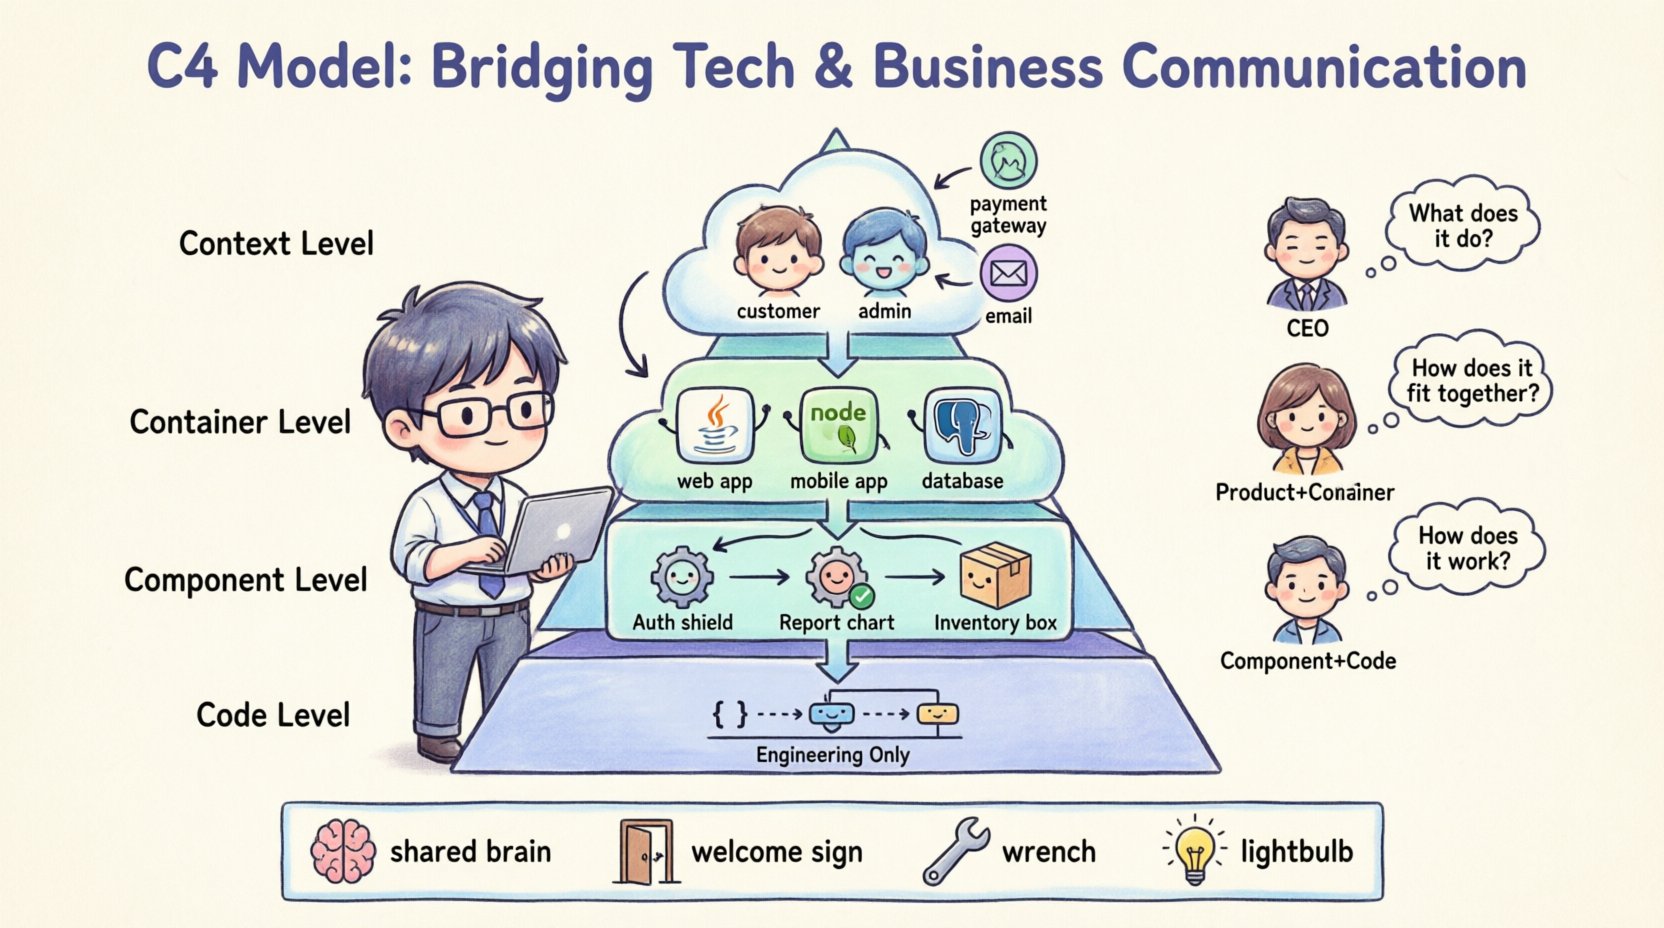
1. Context Level 🌐
The top level of the model provides a high-level overview. It depicts the software system as a single box within its environment. This diagram identifies the system itself and the external entities that interact with it.
- System Scope: Clearly defines what is in scope and what is out of scope for the current project.
- External Users: Identifies the roles of people or systems using the application (e.g., Customers, Administrators).
- Dependencies: Shows other systems the software communicates with (e.g., Payment Gateways, Email Services).
- Communication Flow: Illustrates the direction and type of data exchange between the system and external actors.
This level is crucial for non-technical stakeholders. It answers the question: “What does this system do for us, and who uses it?” It avoids technical jargon entirely, focusing on business value and boundaries.
2. Container Level 📦
Once the scope is understood, the next level zooms in to show how the system is built. A container represents a distinct, deployable unit of software. Examples include web applications, mobile apps, microservices, or databases.
- Technology Stack: Indicates the technology used for each container (e.g., Java, Node.js, PostgreSQL).
- Runtime Environment: Explains how the containers interact at runtime.
- Responsibilities: Describes the specific function of each container within the larger system.
This level bridges the gap between business and engineering. Project managers can see the major components, while developers understand the structural boundaries. It is the first level where technical decisions become visible without overwhelming the reader with code details.
3. Component Level ⚙️
Within each container, the architecture is further broken down into components. A component is a logical grouping of functionality. This level details the internal structure of a container.
- Functional Groups: Groups related features together (e.g., Authentication, Reporting, Inventory Management).
- Internal Interactions: Shows how components communicate with one another inside the container.
- Data Flow: Highlights how information moves through the specific functionality.
For technical leads and senior developers, this is the primary view. It helps in understanding dependencies and potential bottlenecks without needing to read the source code. It clarifies ownership of specific features.
4. Code Level 🧱
The final level delves into the code itself. This typically involves class diagrams or detailed sequence diagrams.
- Class Structure: Shows classes, interfaces, and their relationships.
- Implementation Details: Reveals algorithms, logic paths, and data structures.
While the C4 model includes this level, it is rarely shared with non-technical stakeholders. It serves as the ultimate source of truth for the engineering team to ensure the implementation matches the design intent.
🔍 Why Communication Often Fails
Before diving into solutions, it is necessary to understand why the communication gap exists. Traditional documentation methods often exacerbate the problem.
- Information Overload: Providing a single diagram that contains everything (context and code) confuses everyone. Non-technical stakeholders get lost in details they do not need.
- Terminology Mismatch: Engineers use terms like “latency,” “throughput,” and “microservices.” Business stakeholders hear “speed,” “capacity,” and “apps.” These terms do not map cleanly.
- Static Documentation: Documents created once and filed away become outdated quickly. When the system changes, the documentation does not, leading to a loss of trust.
- Lack of Context: Without a standardized way to represent architecture, every engineer draws diagrams differently. One person’s box might be a database, while another’s is a script.
The C4 model standardizes this visual language. It forces the team to make decisions about what level of detail is appropriate for a specific audience.
🤝 Mapping Stakeholders to Diagram Levels
Not every stakeholder needs to see every diagram. A structured approach ensures the right information reaches the right people at the right time. The table below outlines the optimal communication strategy based on role.
| Stakeholder Role | Primary Diagram Level | Key Question Answered | Frequency of Review |
|---|---|---|---|
| Executive Leadership | Context | What is the system, and does it align with business goals? | Quarterly or Milestone-based |
| Product Managers | Context & Container | What are the major features, and what technology supports them? | Monthly or Sprint Planning |
| Project Managers | Container & Component | What are the dependencies, and how do teams interact? | Weekly or Sprint Retrospective |
| Senior Developers | Component & Code | How does the logic work, and where are the risks? | During Development & Code Review |
| QA / Testers | Component & Container | What are the data flows and entry points for testing? | Before Test Cycles |
| Security Auditors | Container & Component | Where are the data boundaries and access points? | Before Security Reviews |
By adhering to this mapping, you prevent information overload. An executive does not need to see the component diagram to approve a budget. A developer does not need the context diagram to write a function. This precision increases engagement and reduces friction.
💡 Benefits of Adopting a Structured Approach
Implementing this model yields tangible benefits beyond just pretty pictures. It fundamentally changes how the team operates.
1. Shared Mental Models
When everyone draws from the same template, a “box” means the same thing to everyone. This shared mental model reduces the cognitive load required to understand a new feature or a new team member. It creates a common vocabulary.
2. Improved Onboarding
New engineers can grasp the system architecture much faster. Instead of digging through code repositories or reading dense wikis, they can look at the Context and Container diagrams to understand the high-level flow. This reduces the time-to-productivity.
3. Easier Refactoring Decisions
When planning technical debt reduction or refactoring, the team can visualize the impact. If a component is removed, how does the Container diagram change? If a dependency shifts, does the Context diagram need updating? The visual nature makes risk assessment more concrete.
4. Better Requirement Gathering
During the discovery phase, stakeholders can point to boxes and ask, “What happens here?” This prompts specific discussions about data flow and logic that might be missed in text-based requirements. It grounds abstract requirements in visual reality.
🛠️ Best Practices for Implementation
Adopting the model is not a one-time event. It requires discipline and consistency to remain effective.
- Start with the Context: Never start with code. Always establish the boundary first. Define what the system is before defining what it is made of.
- Maintain Consistency: Use the same color coding and shapes across all diagrams. If a database is blue in one diagram, it should be blue in all of them.
- Keep it Updated: Diagrams should not be created just for documentation. They should be part of the development workflow. If code changes, the diagram should change.
- Avoid Over-Detailing: Do not try to put everything into one diagram. If a component diagram becomes too crowded, it has failed. Break it down further or move to the Code level.
- Review Regularly: Schedule architecture reviews where the diagrams are the primary focus. Discuss the diagrams as if they were code.
⚠️ Common Pitfalls to Avoid
Even with a good model, teams can stumble. Here are common mistakes that diminish the value of the C4 model.
1. Creating “Big Ball of Mud” Diagrams
Putting too much information into a single view creates a cluttered mess. If a diagram is too complex to understand, it is useless. Stick to the hierarchy. If you need more detail, create a new diagram for that specific area.
2. Ignoring the Audience
Sending a component-level diagram to a client expecting a business overview causes confusion. Always tailor the view to the recipient. Use the stakeholder mapping table to decide what to share.
3. Treating Diagrams as Art
Focus on clarity, not aesthetics. Do not spend hours perfecting the layout or colors if the logic is unclear. The diagram is a tool for understanding, not a poster for the wall.
4. Neglecting the “Why”
A diagram shows the “What” and the “How.” It often lacks the “Why.” Include annotations or a legend that explains the reasoning behind architectural decisions. Why was this database chosen? Why is this flow synchronous?
🔄 Integrating into the Workflow
To make this sustainable, the model must fit into the existing tools and processes.
- Version Control: Store diagrams alongside the code. This ensures that when the code is versioned, the documentation is versioned too.
- Automated Generation: Whenever possible, generate diagrams from code or configuration files. This reduces the maintenance burden and ensures accuracy.
- Link to Requirements: Connect diagram elements to specific user stories or requirements. This creates a traceability chain from business need to technical implementation.
- Collaborative Editing: Allow multiple stakeholders to view and comment on the diagrams. This encourages feedback and keeps the documentation alive.
📈 Measuring Success
How do you know if the communication has improved? Look for these indicators.
- Reduced Meeting Times: If stakeholders understand the architecture beforehand, meetings can focus on decisions rather than explanations.
- Fewer Misunderstandings: A decrease in requests for clarification regarding system behavior.
- Faster Onboarding: New hires feel confident in the system architecture within their first week.
- Higher Quality Documentation: Stakeholders actively refer to the diagrams rather than ignoring them.
🚀 Moving Forward
Adopting the C4 model is a journey towards clarity. It requires a shift in mindset from viewing documentation as a chore to viewing it as a strategic asset. By respecting the boundaries of abstraction and tailoring the view to the audience, teams can eliminate the noise that often plagues technical communication.
Start small. Draw the Context diagram for your current project. Share it with a non-technical colleague and ask for feedback. Iterate. The goal is not perfection, but understanding. When the architecture is clear, the software built upon it stands a much better chance of success.
Remember that the value lies in the conversation the diagram sparks, not just the diagram itself. Use the structure to facilitate dialogue, resolve conflicts, and align vision. With discipline and consistency, the C4 model becomes more than a set of drawings; it becomes the backbone of your team’s collective understanding.


Comments (0)