C4 Model Best Practices: Creating Clarity Without Overcomplicating
Software architecture is the backbone of any robust system. However, communicating that architecture effectively can be a significant challenge. Too often, diagrams become tangled webs of boxes and lines that confuse stakeholders rather than enlighten them. The C4 model offers a structured approach to visualizing software systems, breaking them down into manageable levels of abstraction. By following best practices, teams can create documentation that serves its purpose: clarity.
This guide explores how to apply the C4 model effectively. We will examine each level of the hierarchy, discuss common pitfalls, and provide strategies for maintaining documentation over time. The goal is not to create perfect diagrams, but to create useful ones that support decision-making and collaboration.
📚 Understanding the Hierarchy
The C4 model consists of four distinct levels. Each level serves a different audience and answers a specific set of questions. Moving from Level 1 to Level 4 increases the level of detail while decreasing the scope of the system being viewed.
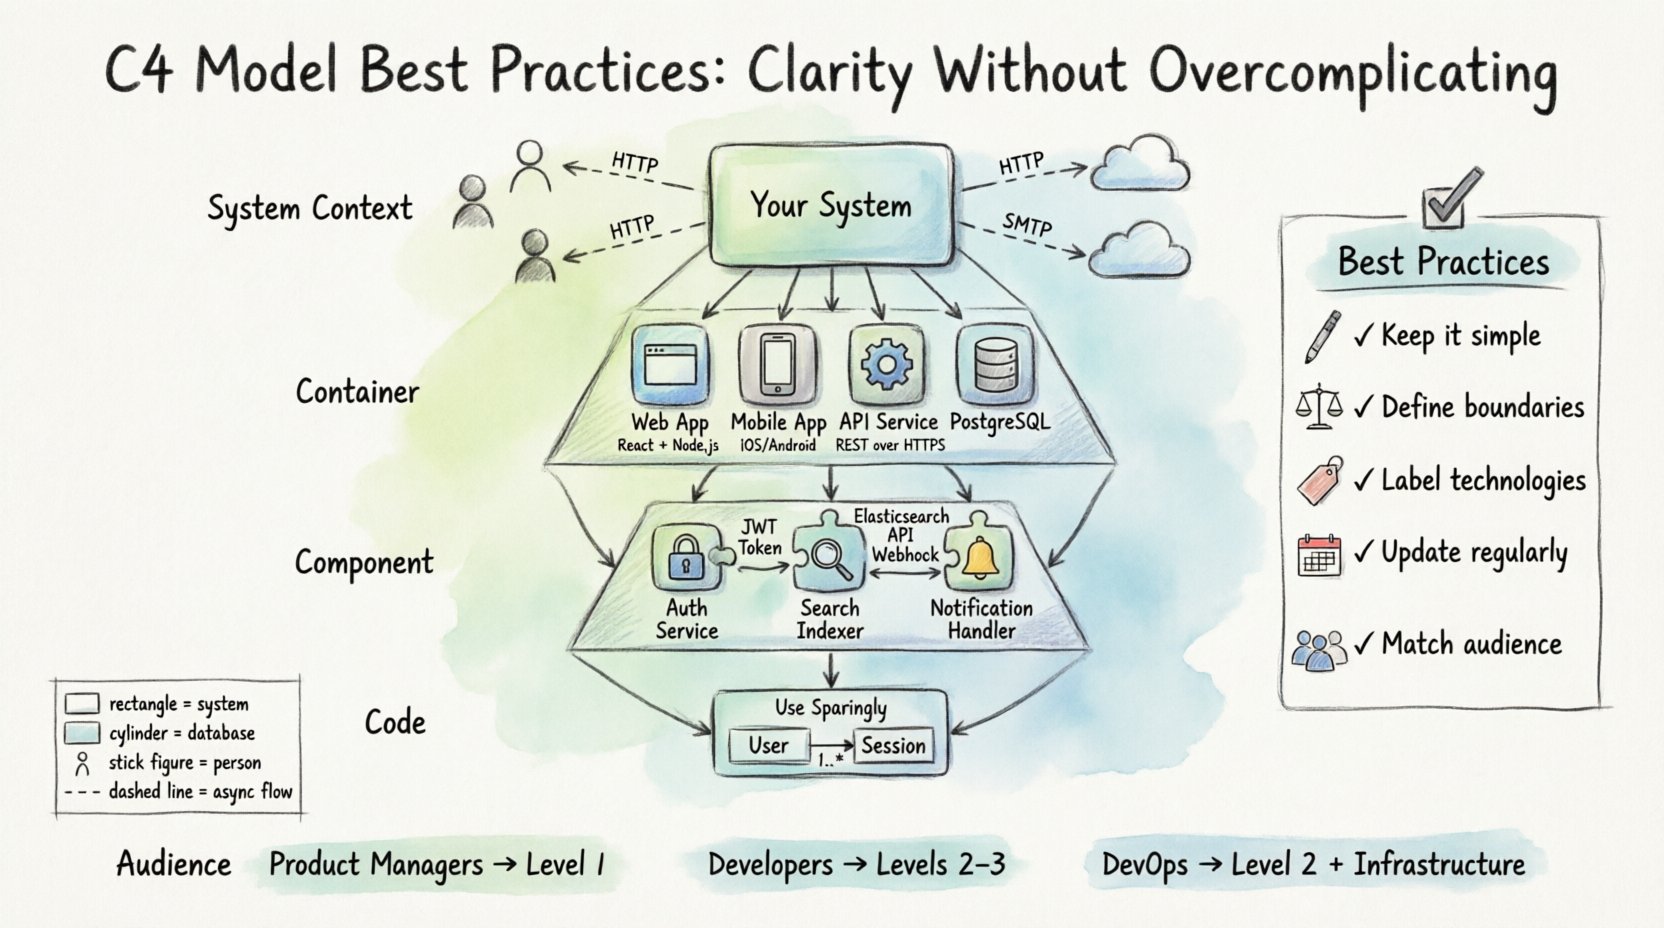
- Level 1: System Context – Shows the system as a single block and its relationship to people and other systems.
- Level 2: Container – Shows the high-level technology choices and how they interact.
- Level 3: Component – Shows the major building blocks within a container.
- Level 4: Code – Shows the internal structure of a component, often mapping to classes or functions.
Using all levels is not always necessary. The key is to use the right level for the right audience. A new developer might start with Level 1 to understand the ecosystem, while a backend engineer might focus on Level 3 to understand data flow.
🌍 Level 1: The System Context Diagram
The System Context diagram is the entry point for understanding a software system. It provides a high-level view that is accessible to everyone, from product managers to external auditors.
What to Include
- The System in Question: Represented as a single box. This is the boundary of your software.
- People: Users, administrators, or roles that interact with the system.
- Other Systems: External services, databases, or legacy systems that communicate with your system.
- Relationships: Lines connecting these entities, labeled with the type of data or interaction.
Best Practices for Context Diagrams
- Keep it Simple: Do not include internal processes. If it is not a system or a person interacting with the system, it does not belong here.
- Define Boundaries Clearly: Ensure the system box is distinct. This defines what you own and what is external.
- Focus on Flow: Use directional arrows to show where data moves. Ask yourself: “Where does information come from and where does it go?”
- Limit Labels: Keep relationship labels concise. Use verbs like “Sends order to” or “Reads data from”.
⚙️ Level 2: The Container Diagram
Once the context is established, the Container diagram dives into the architecture. A container is a high-level unit of deployment. It could be a web application, a mobile app, a microservice, or a database.
Identifying Containers
When drawing this diagram, you need to identify the technology choices. Common containers include:
- Web applications (e.g., React, Angular, Server-side rendering)
- Mobile applications (iOS, Android, Cross-platform)
- Backend services (APIs, Workers)
- Databases (SQL, NoSQL, Key-Value stores)
- File storage systems (Object storage, File servers)
Technical Stack and Interaction
Each container box should ideally include a technology label. This helps developers understand the runtime environment without reading the code. For example, a box might be labeled “Web Application (Node.js)”.
Connections between containers are critical. They represent the communication protocols. These might be HTTP requests, message queues, or direct database connections. Clearly labeling these protocols helps in understanding security requirements and performance characteristics.
Common Mistakes
- Mixing Levels: Do not draw components inside the container box. Keep the container box clean.
- Too Many Containers: If a diagram has more than 10 containers, it is likely too complex. Consider splitting it into multiple diagrams or using a different abstraction.
- Ignoring Protocols: Always specify how containers talk to each other. HTTP is not the same as a direct TCP socket in terms of architecture.
🧩 Level 3: The Component Diagram
Level 3 zooms into a single container to show its internal structure. This is where the logic of the application begins to take shape. It is useful for developers who need to understand how a specific feature is implemented within a service.
Defining Components
A component represents a distinct unit of functionality. Unlike containers, components do not typically have their own deployment boundary. They run within the container. Examples include:
- Authentication Service
- Reporting Engine
- Search Indexer
- Notification Handler
Structuring the Diagram
When creating a Component diagram, group related functionality together. Use packages or subgroups to organize components logically. This helps readers navigate the complexity.
Focus on the interfaces. How does one component talk to another? Are they synchronous or asynchronous? Do they share data stores? Highlighting these interactions prevents the diagram from becoming a static list of code modules.
When to Stop at Level 3
Level 3 is often the sweet spot for most documentation. It provides enough detail to guide development without getting bogged down in class definitions. If you find yourself needing to explain the internal logic of a component, consider if a code snippet or a separate note is better than adding a Level 4 diagram.
💻 Level 4: The Code Diagram
Level 4 diagrams are rare in standard architectural documentation. They map directly to code structures, such as classes, functions, and methods. While detailed, they are often too volatile to maintain alongside high-level architecture.
When to Use Level 4
- Complex Algorithms: If a specific algorithm is the core of the system, a class diagram might be necessary.
- Legacy Migration: When documenting old systems to understand dependencies.
- Security Audits: Sometimes specific data flow within a class is required for compliance.
Challenges
The primary challenge with Level 4 is maintenance. Code changes frequently. Diagrams do not. If a class is renamed or a method is removed, the diagram becomes inaccurate. Use this level sparingly and consider generating it automatically if possible.
📊 Comparison of Diagram Levels
| Level | Audience | Focus | Typical Duration |
|---|---|---|---|
| System Context | Stakeholders, Managers | Boundaries and External Systems | 1-3 Months |
| Container | Architects, DevOps | Tech Stack and Deployment | 1-6 Months |
| Component | Developers | Internal Logic and Interfaces | 1-3 Weeks |
| Code | Senior Engineers | Class Structure and Methods | Dynamic / Automated |
🛠️ General Best Practices
Regardless of the level you are working on, certain principles apply to ensure your diagrams remain effective tools.
Consistency is Key
Adopt a naming convention for your boxes and labels. If you call a database “Postgres DB” in one diagram, do not call it “Database” in another. Consistency reduces cognitive load for anyone reading multiple diagrams.
- Standard Shapes: Use rectangles for systems, cylinders for databases, and stick figures for people.
- Color Usage: Use color sparingly. Reserve it for highlighting specific concerns, such as security zones or deprecated technology.
- Directionality: Ensure all arrows flow logically. Avoid arrows pointing back and forth on the same line unless bidirectional flow is explicitly required.
Avoid Over-Engineering
It is tempting to make diagrams look like art. Resist this urge. The goal is communication, not aesthetics. Simple lines and boxes are better than complex flows that obscure the main point.
- Limit Lines: If a box has too many connections, it is likely doing too much. Consider splitting the container or component.
- Remove Noise: Do not show every API endpoint. Show the service that hosts the endpoint.
- Focus on Data: What data is moving? Why is it moving? If a connection has no data flow, consider removing it.
🔄 Maintenance and Version Control
Diagrams become outdated quickly. A common failure mode is creating a diagram during a sprint and never updating it again. To prevent this, treat diagrams as code.
Integration with Workflow
Include diagram updates in your definition of done. If a major architectural change occurs, the diagram must be updated alongside the code. This ensures the documentation remains a source of truth.
Versioning
Store diagrams in the same repository as the code. This allows you to track changes over time. When a diagram changes, it should be part of a commit message. This provides a history of why decisions were made.
- Commit Messages: “Updated Container diagram to reflect new cache service”.
- Branching: Keep diagrams in a branch if you are planning a major refactor before applying it to the main branch.
- Review Process: Include architecture diagrams in pull request reviews. This ensures peer validation of the visual representation.
👥 Audience Considerations
One size does not fit all. You must tailor the diagram to the person reading it.
For Product Managers
Focus on Level 1. They need to understand what the system does and who it interacts with. Avoid technical details like container types or database schemas. Focus on user flows and external dependencies.
For Developers
Focus on Level 2 and Level 3. They need to know how to integrate with the system. Show APIs, data stores, and internal components. Use technology labels to help them set up their environments.
For DevOps
Focus on Level 2 and infrastructure. Show deployment units, load balancers, and network boundaries. Highlight security zones and data storage locations. This helps in provisioning and securing the environment.
🚧 Common Pitfalls to Avoid
Even with best practices in mind, teams often fall into traps that reduce the value of the documentation.
- The Iceberg Syndrome: Drawing the top of the iceberg (the visible UI) without showing the support structure underneath. Ensure you show the backend logic that powers the frontend.
- The Black Box: Treating a container as a black box without explaining what happens inside. If the internal logic is complex, provide a Level 3 diagram.
- The Data Lake: Showing every single table and field in a database diagram. This is rarely useful. Show the logical entities, not the physical schema.
- Static Documentation: Updating the diagram once and never touching it again. Treat documentation as a living artifact.
- Ignoring Non-Functional Requirements: Architecture is not just about features. Show security boundaries, performance bottlenecks, and availability zones where relevant.
🔍 Tooling and Automation
While specific tools vary, the principle remains the same. Choose a tool that supports the C4 model structure. Ideally, the tool should allow you to generate diagrams from code or configuration where possible. This reduces the manual effort required to keep diagrams up to date.
Some teams use text-based descriptions to generate diagrams. This makes version control easier and keeps the diagram definition close to the code. Others prefer visual editors. Both are valid as long as the output is clear and maintainable.
📝 Summary of Key Actions
To ensure your architecture documentation is effective, follow these actionable steps:
- Start with Context: Always begin with the System Context diagram to set the stage.
- Define Boundaries: Clearly mark what is inside and outside your system.
- Label Technologies: Always specify the tech stack for containers.
- Limit Detail: Do not show code unless absolutely necessary.
- Update Regularly: Make diagram updates part of the development cycle.
- Review with Team: Have peers validate the accuracy of the diagrams.
By adhering to these practices, you create a documentation system that supports the team rather than hindering it. Clarity is the ultimate goal of architecture documentation. It enables better decisions, faster onboarding, and more resilient systems.


Comments (0)