C4 Model in Action: A Step-by-Step Walkthrough for First-Time Users
Software systems are complex. They grow. They change. Often, the documentation lags behind the code, leaving new team members confused about how the pieces fit together. Visual diagrams help bridge this gap, but too many styles exist, leading to confusion. The C4 Model offers a structured approach to software architecture documentation. It provides a clear hierarchy of abstractions that scales from high-level context down to code-level detail.
This guide walks you through the C4 Model. You will learn how to create diagrams that communicate effectively. We will cover every level, from Context to Code, and discuss best practices to keep your documentation useful. No hype, just practical steps for technical teams.
📚 Understanding the C4 Model Hierarchy
The C4 Model is a collection of standard diagrams used to visualize software architecture. It focuses on the relationship between parts rather than implementation details. The model is hierarchical. You start broad and drill down into specifics only when necessary.
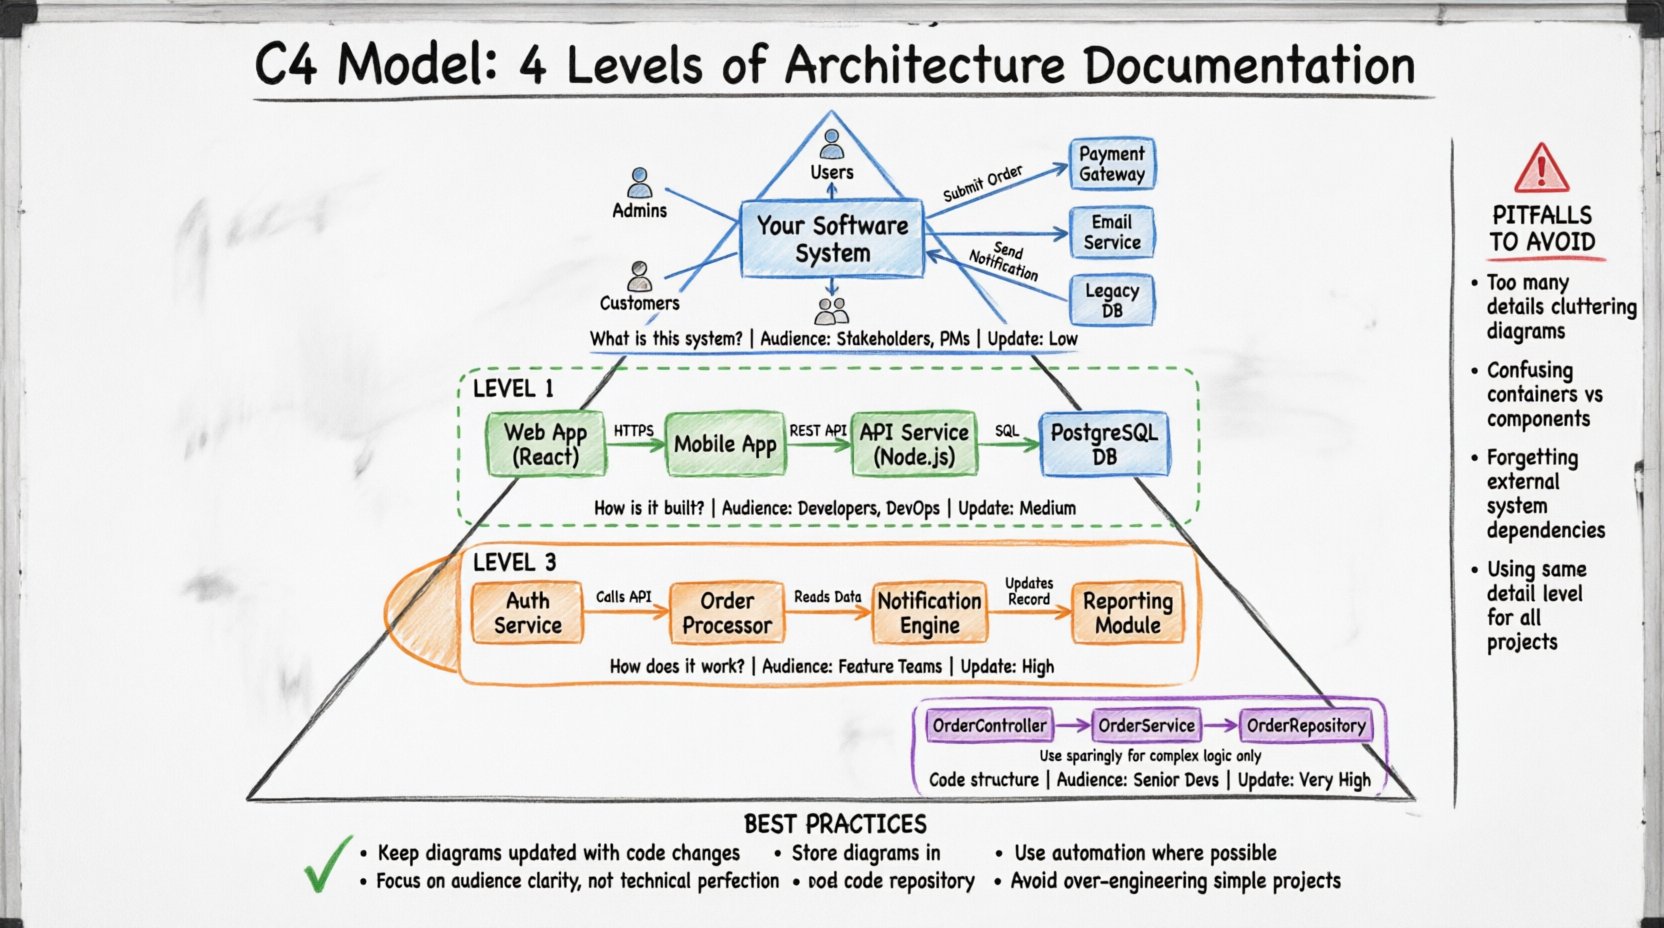
There are four levels of abstraction. Each level answers a different question for a different audience. This structure prevents information overload. You do not need to document everything at every level.
Level 1: System Context Diagram
This is the broadest view. It shows the software system as a single box. It identifies who uses it and what other systems it talks to. It answers the question: What is this system?
- Audience: Stakeholders, Project Managers, New Developers.
- Scope: The entire software system.
- Goal: Define boundaries and external dependencies.
Level 2: Container Diagram
This level breaks the system into larger building blocks. A container is a deployable unit. It could be a web application, a mobile app, a database, or a microservice. It answers the question: How is the system built?
- Audience: Developers, Architects, DevOps Engineers.
- Scope: Internal structure of the system.
- Goal: Explain technology choices and data flow between components.
Level 3: Component Diagram
This level zooms into a single container. It shows the internal logic. Components are groups of functionality, like a Service Layer or a Repository. It answers the question: How does it work?
- Audience: Developers working on specific features.
- Scope: Inside one container.
- Goal: Detail interactions and data flow within a container.
Level 4: Code Diagram
This level shows classes and methods. It is rarely used for high-level architecture. It is useful for complex algorithms or specific design patterns. It answers the question: How is the code structured?
- Audience: Senior Developers, Code Reviewers.
- Scope: Source code structure.
- Goal: Explain specific logic implementation.
📊 Comparing Diagram Levels
Understanding when to use each level is critical. Over-documenting Level 4 is a common mistake. Under-documenting Level 1 leads to confusion. Use the table below to guide your documentation strategy.
| Level | Focus | Typical Audience | Update Frequency |
|---|---|---|---|
| 1 | System & External Users | Business & Tech Leads | Low (Major Changes) |
| 2 | Technology Stack & Boundaries | Developers & Ops | Medium (Tech Changes) |
| 3 | Internal Logic | Feature Teams | High (Feature Updates) |
| 4 | Classes & Methods | Core Developers | Very High (Code Changes) |
🔍 Level 1: Creating the System Context Diagram
The System Context Diagram is your starting point. It sets the stage. It defines the perimeter of your work. Without this, the rest of the documentation lacks context.
Core Elements
You need three types of elements for this diagram:
- Software System: The central box. This is what you are building or documenting. It should be labeled clearly with the system name.
- People: Users or roles that interact with the system. Examples include Administrators, Customers, or Support Staff.
- External Systems: Other software your system relies on. Examples include Payment Gateways, Email Services, or Legacy Databases.
Visual Conventions
Keep it simple. Use a rectangle for the system. Use a human icon for people. Use a cylinder or box for external systems.
Draw lines between them to show interaction. Label the lines with the data or action being exchanged. For example, “Submit Order” or “Receive Email”. Avoid technical jargon here. Keep the language business-friendly.
Step-by-Step Creation
- Identify the System: Place the main system in the center of the canvas.
- Identify Actors: Draw people or groups around the system. Ask: Who uses this? Who is affected by this?
- Identify Dependencies: Draw external systems. Ask: What do we need to function? What do we send data to?
- Draw Connections: Connect the actors and systems to the main box. Add labels to the lines.
- Review: Check if the diagram makes sense to a non-technical stakeholder.
🛠️ Level 2: Creating the Container Diagram
Once the system boundary is clear, you need to look inside. Containers are the building blocks. They represent the runtime environment.
Defining Containers
A container is a distinct, deployable unit. It is not a single file. It is a process or a service. Common examples include:
- Web Application: A browser-based interface (e.g., React, Angular).
- Mobile Application: An app on a phone (e.g., iOS, Android).
- Database: Storage for persistent data (e.g., PostgreSQL, MongoDB).
- Microservice: A backend API service (e.g., Node.js, Python).
- Batch Job: A scheduled task (e.g., Data Import, Report Generation).
Visual Conventions
Use rounded rectangles for containers. Differentiate them by color or icon based on their technology type. This helps readers identify the stack quickly.
Connect containers with lines. These lines represent data flow. Label them with the protocol or data type. For example, “HTTPS”, “REST API”, or “SQL Query”.
Step-by-Step Creation
- Start with Level 1: Open your system context diagram.
- Expand the System Box: Replace the single system box with multiple container boxes.
- Assign Technologies: Label each container with the technology used (e.g., “Node.js API”, “PostgreSQL DB”).
- Draw Connections: Map how containers talk to each other. Ensure you show data flow direction.
- Review Boundaries: Check if any container crosses logical boundaries. If so, consider splitting them.
⚙️ Level 3: Creating the Component Diagram
When a container becomes too complex, you drill down. A container might contain hundreds of classes. You cannot draw all of them. You group them into components.
Defining Components
Components are logical groupings of functionality. They are not physical files. They are cohesive units of behavior. Examples include:
- Authentication Service: Handles login and token management.
- Order Processing: Manages order lifecycle and validation.
- Notification Service: Sends emails and push notifications.
- Reporting Engine: Generates PDFs and charts.
Visual Conventions
Use a standard rectangle for components. Use different colors to indicate responsibility areas. Connect components with lines. These lines show dependencies or data access.
Label lines with the interaction type. For example, “Calls API”, “Reads Data”, or “Updates Record”.
Step-by-Step Creation
- Select a Container: Choose the most complex container from Level 2.
- Identify Responsibilities: List the major functions this container performs.
- Group into Components: Group related functions together.
- Draw Relationships: Show how components interact. Highlight critical paths.
- Document APIs: If a component exposes an interface, note it clearly.
💻 Level 4: The Code Diagram (Optional)
Level 4 is often skipped. It is too detailed for general architecture. However, it has its place.
When to Use Level 4
- Explaining a complex algorithm.
- Documenting a critical design pattern.
- Onboarding a developer to a specific module.
Best Practices for Code Diagrams
Do not draw every class. Focus on the flow of control. Show the key objects involved in a specific operation. Keep it static. Dynamic sequence diagrams are often better for showing time-based behavior.
🛡️ Best Practices for Documentation
Creating diagrams is one thing. Keeping them useful is another. Documentation decays quickly. You need strategies to maintain it.
1. Keep It Updated
Outdated diagrams are worse than no diagrams. They create false confidence. Make diagram updates part of your deployment process. If the code changes the architecture, the diagram must change.
2. Focus on the Audience
Do not write for yourself. Write for the team. If a diagram requires deep knowledge to understand, it has failed. Aim for clarity. Use standard icons.
3. Avoid Over-Engineering
Not every project needs all four levels. A simple script might only need Level 1. A large enterprise system needs Levels 1, 2, and 3. Assess the complexity before starting.
4. Use Automation Where Possible
Manually drawing diagrams is time-consuming. Some tools can generate diagrams from code. While manual drawing allows for abstraction, automated generation ensures accuracy. Balance both approaches.
5. Store Diagrams with Code
Do not store diagrams in a separate wiki that is hard to find. Store them in the repository with the code. This ensures they are version controlled and updated with the code.
🚧 Common Pitfalls to Avoid
Even experienced architects make mistakes. Here are common issues to watch out for.
- Too Many Details: Including every class in a Level 3 diagram makes it unreadable. Stick to high-level components.
- Confusing Containers and Components: Do not put a microservice (Container) inside a service class (Component). Maintain the hierarchy.
- Ignoring External Systems: Forgetting to document the payment gateway or third-party API leads to integration surprises later.
- Static Lines Only: Using only static lines for data flow can be confusing. Use arrows to show direction clearly.
- One Size Fits All: Trying to use the same level of detail for all systems. Tailor the depth to the project needs.
🔄 Maintenance and Evolution
Software evolves. Requirements change. The architecture must reflect this. Treat the documentation as a living artifact.
Review Cycles
Schedule regular reviews. Every quarter, look at your diagrams. Are they still accurate? Do they reflect the current state? If a major refactor occurred, update the diagrams immediately.
Training New Hires
Use the diagrams as an onboarding tool. Show new team members the Context diagram first. Then move to Containers. This builds a mental model of the system before they touch the code.
Communication Tool
Use the diagrams in meetings. When discussing a feature, point to the relevant component. It speeds up discussion. It reduces ambiguity. It aligns the team.
🎯 Final Thoughts
The C4 Model provides a clear path for documentation. It prevents the chaos of ad-hoc diagrams. By following the hierarchy, you ensure that every stakeholder sees what they need to see.
Start with the Context. Add Containers. Drill down to Components. Use Code diagrams sparingly. Keep the diagrams updated. Share them widely.
Remember, the goal is communication. If the diagram helps someone understand the system faster, it has succeeded. If it sits in a folder and no one looks at it, it has failed. Prioritize clarity and maintenance over perfection.
With practice, creating architecture diagrams becomes second nature. You will find yourself sketching them out in meetings. You will spot design issues before coding begins. This is the true value of the C4 Model.


Comments (0)