C4 Model Explained: A Beginner’s Guide to Visualizing Software Architecture
Software architecture is the backbone of any robust application. It dictates how components interact, how data flows, and how the system scales. Yet, describing these intricate structures in text is often insufficient. Diagrams provide clarity, but without a standardized approach, they become confusing messes. This is where the C4 Model comes into play.
The C4 Model offers a structured way to create software architecture diagrams at different levels of detail. It helps teams communicate effectively, onboard new members, and maintain documentation over time. By following this guide, you will understand how to visualize your system without getting lost in the weeds. We will explore the four levels, the principles behind them, and how to apply them to your projects.
🤔 What is the C4 Model?
The C4 Model is a method for creating software architecture diagrams. It focuses on the abstraction of your system. Instead of trying to show everything at once, it breaks down the architecture into manageable chunks. This prevents information overload.
Many teams struggle with documentation because they try to capture too much detail in a single image. The C4 Model solves this by offering a hierarchy of views. Each view serves a different audience and purpose. You might need to show the high-level business context to stakeholders, while developers need to see the component relationships.
Key Principles of the Model:
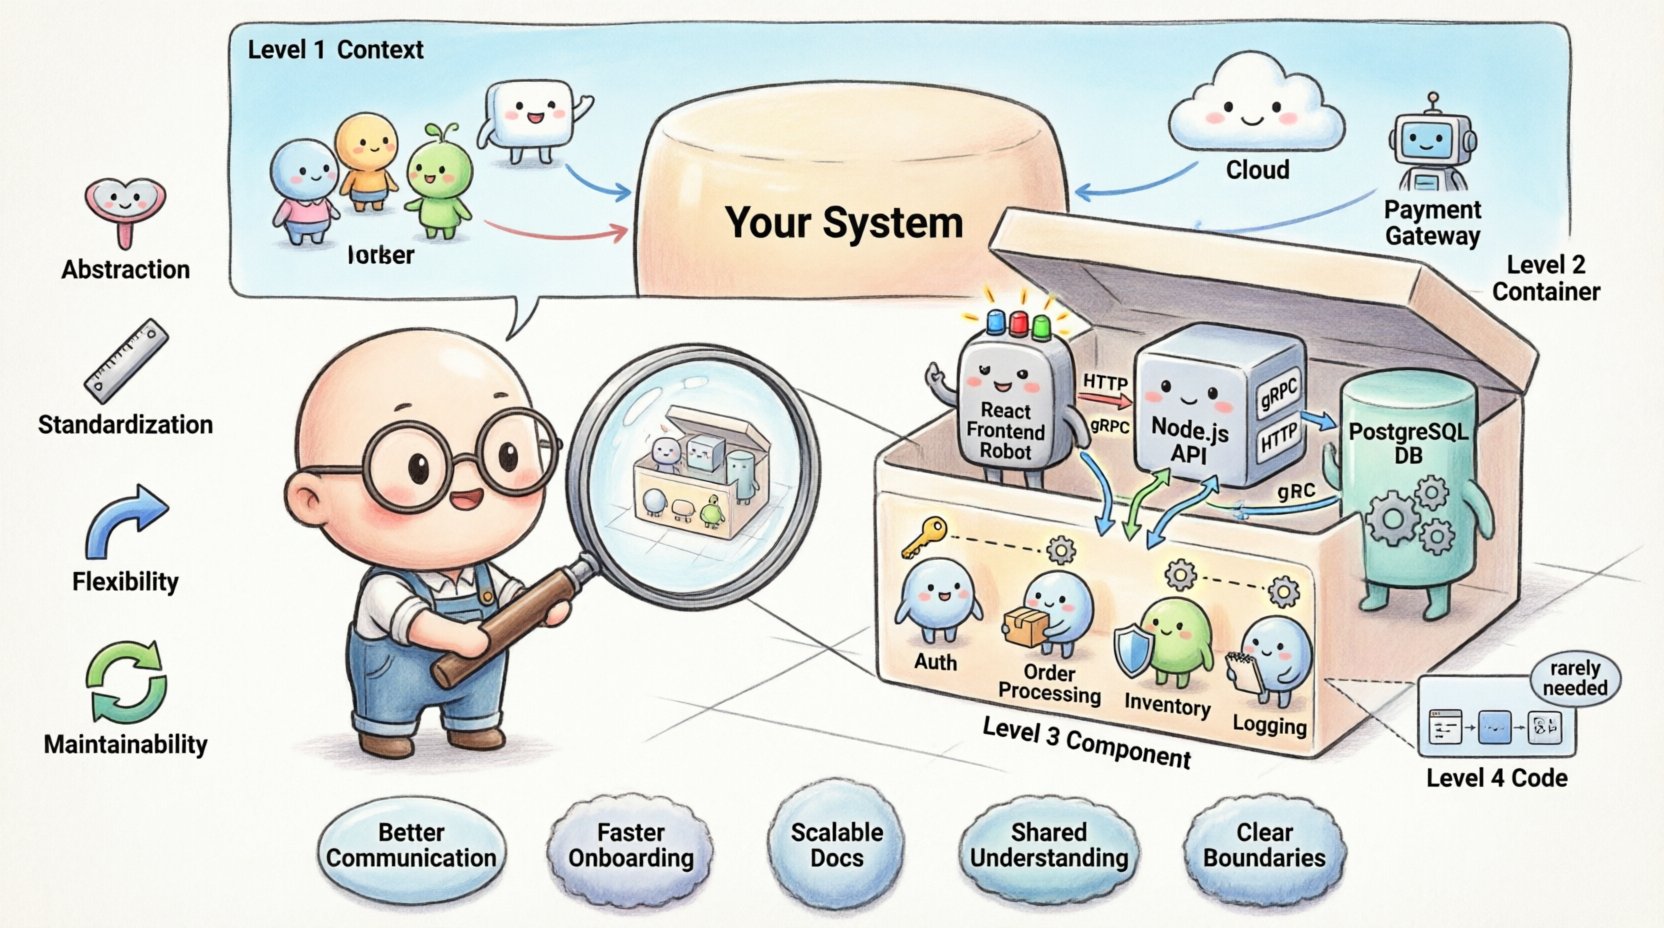
- Abstraction: Show only what is relevant for the current audience.
- Standardization: Use consistent shapes and symbols across all diagrams.
- Flexibility: Adapt the depth based on the complexity of the system.
- Maintainability: Ensure diagrams can be updated as the code evolves.
By adhering to these principles, you create a living documentation system that remains useful long after it is created.
🏛️ The Four Levels of the C4 Model
The core of this model lies in its four distinct levels. Each level zooms in on the system, providing more detail than the last. Think of it like a map. You might start with a world map to see continents, then zoom into a country, then a city, and finally a street.
Level 1: Context Diagram 🌍
The Context Diagram provides the highest level view. It shows the system you are building and its relationship with the external world. This diagram is primarily for stakeholders, including business managers, clients, and new developers.
What belongs in a Context Diagram:
- The System: Represented as a single box with the system name.
- Users: People who interact with the system (e.g., Admin, Customer).
- External Systems: Other software that the system talks to (e.g., Payment Gateway, Email Service).
- Relationships: Lines connecting users and systems to your main system.
At this level, you do not care about databases, microservices, or code. You care about the value the system provides. For example, a diagram might show that a Customer uses the Online Store to place orders, and the Online Store uses the Payment Processor to handle money.
Level 2: Container Diagram 📦
Once the context is clear, we zoom in to see how the system is built. The Container Diagram breaks the single system box into multiple containers. A container is a deployable unit of software. It could be a web application, a mobile app, a database, or a microservice.
What belongs in a Container Diagram:
- Containers: Boxes representing the technology stack (e.g., React Frontend, Node.js API, PostgreSQL Database).
- Technology: Labels indicating the language or tool (e.g., Python, Java, AWS).
- Connections: Lines showing how containers communicate (e.g., HTTP, gRPC, SQL).
- External Systems: Any outside dependencies remain visible.
This view is crucial for developers and architects. It answers the question: “What technologies are we using and how do they connect?” It helps identify bottlenecks and security boundaries between different parts of the infrastructure.
Level 3: Component Diagram ⚙️
If you need to dive deeper, the Component Diagram shows the internal structure of a container. A container might be too complex to understand without breaking it down further. A component is a logical grouping of functionality within a container.
What belongs in a Component Diagram:
- Components: Groups of code that perform specific tasks (e.g., User Authentication, Order Processing).
- Interfaces: How components talk to each other.
- Relationships: Dependencies and data flow between components.
This level is often used during the design phase of specific features. It helps teams understand the logic without needing to read the actual code. It bridges the gap between high-level architecture and low-level implementation.
Level 4: Code Diagram 💻
The final level is the Code Diagram. This shows classes and methods. In most cases, this level is optional. The C4 Model suggests stopping at Level 3 because code changes frequently, and diagrams become outdated quickly.
When to use Level 4:
- Complex algorithms that are hard to explain in text.
- Specific performance optimizations.
- Legacy systems where documentation is missing.
For most modern applications, Levels 1 through 3 provide sufficient clarity. Relying too heavily on code-level diagrams can lead to maintenance nightmares.
📊 Comparison of Diagram Levels
Understanding the differences between the levels is critical for choosing the right view. The table below summarizes the key distinctions.
| Level | Focus | Audience | Typical Content |
|---|---|---|---|
| 1. Context | System in Environment | Stakeholders, Managers | Users, External Systems |
| 2. Container | Deployable Units | Developers, Architects | Web Apps, Databases, APIs |
| 3. Component | Logical Grouping | Developers | Modules, Services, Classes |
| 4. Code | Implementation Details | Senior Developers | Classes, Methods, Functions |
🛠️ Best Practices for Diagramming
Creating diagrams is an art. To make them effective, you must follow certain guidelines. Poorly drawn diagrams can be more confusing than no diagrams at all. Here are strategies to ensure your visualizations add value.
1. Keep It Simple
Every line and box should serve a purpose. If a relationship does not impact the flow of data or control, leave it out. Avoid showing every single API endpoint. Focus on the critical paths that define the system’s behavior.
2. Use Consistent Notation
Define a standard for your team. If a database is a cylinder in one diagram, it must be a cylinder in all of them. Use colors consistently to denote environment (e.g., production vs. development) or technology type. Consistency reduces cognitive load for the reader.
3. Document Relationships
A box without a line is useless. The lines tell the story. Label your connections. Instead of a blank line, write “HTTP” or “Async Message”. This clarifies the protocol and the nature of the interaction.
4. Version Control Your Diagrams
Treat diagrams as code. Store them in your repository. This allows you to track changes over time. When a diagram changes, review it alongside the code change. This ensures documentation stays in sync with implementation.
5. Focus on the Audience
Do not create a Level 3 diagram for a project manager. They do not need to see components. They need the Level 1 Context view. Tailor the output to the person reading it. This ensures the information is digestible and relevant.
🚧 Common Mistakes to Avoid
Even experienced architects can fall into traps when visualizing systems. Being aware of these pitfalls will save you time and frustration.
- Too Much Detail: Trying to fit the entire system into one image. Remember the hierarchy. If a diagram is cluttered, split it into multiple views.
- Outdated Diagrams: Creating a diagram and never updating it. A stale diagram is worse than no diagram because it misleads readers. Commit to regular reviews.
- Inconsistent Shapes: Using different shapes for the same type of element. This confuses the reader about the nature of the component.
- Ignoring Security: Failing to mark authentication boundaries or data sensitivity. Security should be visible in your architecture, not hidden.
- Over-Engineering: Creating a diagram before the system is designed. Sometimes, the best diagram comes after the code is written, to reflect reality.
💡 Benefits of Adopting the C4 Model
Why should you invest time in learning and applying this model? The benefits extend beyond just pretty pictures. It impacts the culture and efficiency of the engineering team.
Improved Communication
Discussions about architecture often stall because everyone visualizes the system differently. A standardized model aligns mental models. When everyone agrees on what a “Container” is, discussions become more efficient.
Faster Onboarding
New team members often struggle to understand the codebase. Architecture diagrams provide a roadmap. A Level 1 diagram tells them what the system does. A Level 2 diagram tells them where the code lives. This reduces the time spent asking questions.
Better Decision Making
When planning changes, you can see the impact on other parts of the system. If you want to change a database, the diagram shows which containers depend on it. This prevents breaking changes and reduces risk.
Scalable Documentation
As the system grows, documentation can become unmanageable. The C4 Model scales with the project. A small app might only need Level 1 and 2. A large enterprise system might use all four levels. The structure adapts to the complexity.
🔄 Implementing the Model in Your Workflow
How do you start? You do not need to overhaul your entire documentation process overnight. Start small and iterate.
- Start with Context: Draw the Level 1 diagram for your current project. Identify the users and external systems. This sets the stage.
Add Containers: If the system is complex, break the main box into containers. Identify the tech stack.- Review Regularly: Make diagram updates part of your pull request process. If code changes affect the architecture, the diagram must change.
- Encourage Collaboration: Allow developers to annotate diagrams. This creates a shared ownership of the documentation.
- Keep it Visual: Use clear icons and labels. Avoid walls of text. The goal is visual understanding.
🧩 The Role of Abstraction
Abstraction is the most important concept in this model. It is the ability to hide complexity. When you create a Context Diagram, you abstract away the database and the code. You only show the value.
This is why the C4 Model is effective. It respects the cognitive limits of the human brain. We cannot hold the entire system in our head at once. By breaking it down, we can understand each piece individually and then see how they fit together.
Consider a car engine. You can look at the whole car (Context). You can look at the engine block (Container). You can look at the pistons (Component). You can look at the metal atoms (Code). Each view is valid for a specific purpose. The C4 Model ensures you choose the right view for the right moment.
🔍 Handling Complexity
Large systems often require multiple diagrams of the same level. For example, a Level 2 diagram might become too crowded if you have 50 containers. In this case, split the diagram by domain. Create one diagram for the “Ordering Domain” and another for the “Billing Domain”.
Strategies for Splitting Diagrams:
- By Business Domain: Group by functional area.
- By Technology: Group by backend, frontend, and infrastructure.
- By Team: Group by the teams responsible for the components.
Ensure that the relationships between these split diagrams are clear. Use reference boxes to indicate that a container exists in another diagram. This maintains the coherence of the overall architecture.
📝 Final Thoughts on Architecture Visualization
Building software is a complex endeavor. Visualizing that complexity is just as important as writing the code itself. The C4 Model provides a reliable framework for this task. It balances detail with clarity, ensuring that your documentation remains a useful asset rather than a burden.
By focusing on the four levels, you can communicate effectively with everyone from business leaders to junior developers. Remember to keep your diagrams up to date and relevant. Treat them as code. And most importantly, focus on the story your architecture tells.
Start today. Pick a system you are working on. Draw the Level 1 diagram. See how much clearer the conversation becomes. With practice, you will find that visualizing architecture becomes a natural part of your development process.
Architecture is not just about boxes and lines. It is about understanding how the pieces fit together to create value. The C4 Model gives you the tools to map that value clearly and effectively.


Comments (0)