Visualizing Quarterly Business Goals: A 3-Aspect Infographic Guide
Are you struggling to communicate complex business strategies in a way that’s both clear and compelling? The Three Aspects Infographic Designer from Visual Paradigm offers a powerful solution, transforming abstract concepts into visually engaging, structured insights. This AI-powered tool allows users to generate professional infographics based on a three-part framework, such as Strategy, Implementation, and Performance (SIP), in a matter of minutes. By simply entering a topic like “Quarterly Business Goals” and selecting a predefined analysis type, the application leverages artificial intelligence to populate the three distinct sections with relevant content, eliminating the need for time-consuming manual design. This article explores how this innovative software streamlines the process of creating impactful visual reports for strategic planning, enabling business professionals to focus on analysis rather than design.
For those who need to present complex information quickly and effectively, the Three Aspects Infographic Designer is a game-changer. It’s not just another diagramming tool; it’s a strategic communication engine. The process begins with a simple input: a topic and an analysis type. The AI then takes over, analyzing the input and generating a complete, content-rich infographic. This capability is particularly valuable for business strategists, product managers, and marketing professionals who must distill complex data into digestible insights for stakeholders. The result is a polished, professional visual that can be easily shared, ensuring that your message is communicated with maximum impact. The tool’s intuitive interface and powerful AI functionality make it one of the most efficient ways to create high-quality, data-driven visuals.
How the Three Aspects Infographic Designer Works
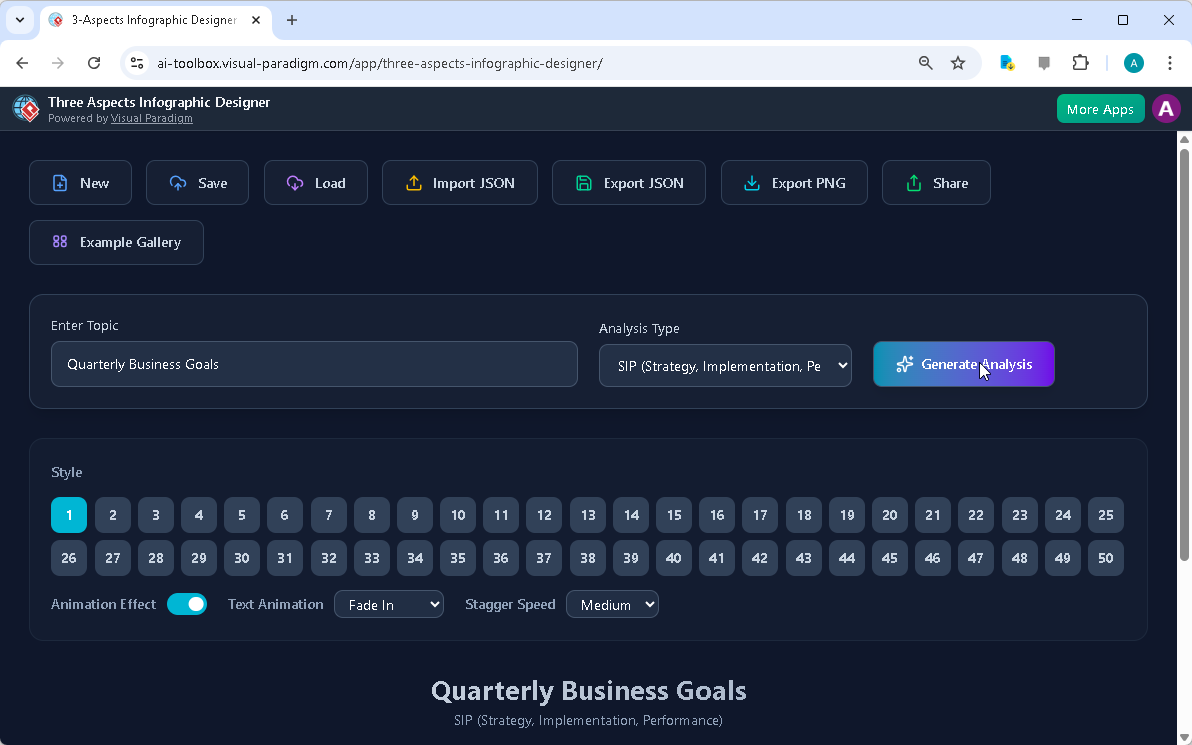
The workflow of the Three Aspects Infographic Designer is designed for speed and simplicity, starting with a user-friendly interface. The initial screen, as seen in Image 1, presents a clean dashboard where users can enter their topic and select an analysis type. In the example shown, the topic is “Quarterly Business Goals,” and the chosen analysis type is SIP (Strategy, Implementation, Performance). This combination provides the AI with the necessary context to generate relevant content. After inputting these details, the user clicks the “Generate Analysis” button. The AI then processes the information, creating a structured infographic with three distinct sections, each representing one of the chosen aspects. This initial step is crucial for establishing a clear and logical foundation for the entire visualization.
Image 1: The landing screen of the Three Aspects Infographic Designer, showing the input fields for the topic and analysis type, as well as the ‘Generate Analysis’ button. The user has entered “Quarterly Business Goals” and selected the SIP analysis type.
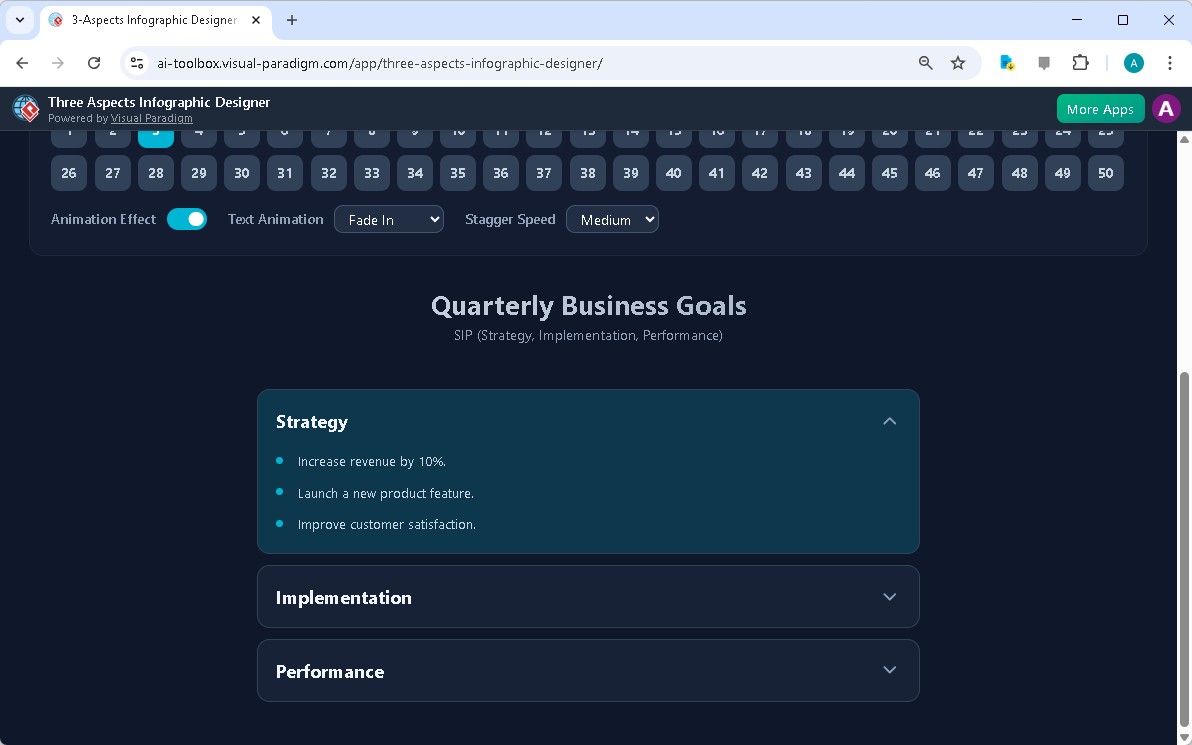
Once the AI has generated the initial content, the user is presented with the finished infographic, as displayed in Image 2. The interface now shows the three distinct aspects—Strategy, Implementation, and Performance—each with a list of bullet points. The user can then refine this content, editing the text directly within the infographic to ensure accuracy and relevance. The tool also provides a wide range of customization options, including over 50 different visual styles to choose from, allowing users to tailor the aesthetic to their brand or presentation style. Furthermore, the application supports dynamic text animations, such as a “Fade In” effect, which can be adjusted to control the pacing of the information delivery, enhancing the overall engagement of the presentation.
Image 2: The generated infographic, showing the three aspects (Strategy, Implementation, Performance) with AI-generated content. The user can customize the layout and animations.
Sharing and Managing Your Infographic
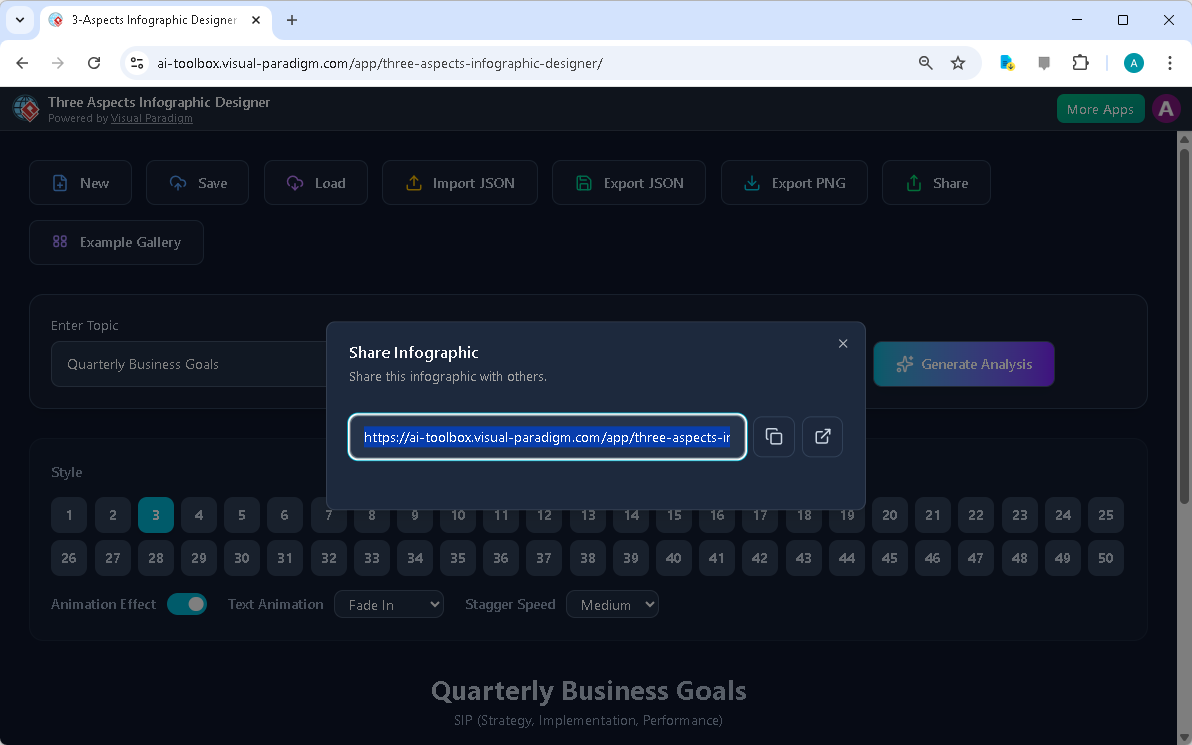
After creating and refining an infographic, the final step is to share it with others. The Three Aspects Infographic Designer simplifies this process with a robust sharing system. As illustrated in Image 3, users can generate a unique, read-only URL for their infographic. This link can be shared via email, messaging apps, or embedded in a presentation. The recipient can open the link in a browser, where the infographic will load in a dedicated “viewer mode,” which hides all editing controls to ensure a clean, professional presentation. This feature is invaluable for sharing insights with clients, team members, or executives without the risk of accidental edits. The ability to save projects to the cloud ensures that your work is always accessible and secure, allowing for seamless collaboration and continuous refinement.
Image 3: The share screen of the Three Aspects Infographic Designer, showing the generated URL for the infographic. The user can copy the link or share it directly.
Key Benefits and Use Cases
The Three Aspects Infographic Designer offers a multitude of benefits that cater to various professional needs. For business strategists and financial analysts, it provides a fast and efficient way to visualize complex frameworks like Economic Value Added (EVA), ensuring that strategic models are presented clearly and professionally. Product managers can use it to analyze new features across three critical dimensions, such as Value, Feasibility, and Desirability, making the decision-making process more structured. For marketing professionals, the tool is ideal for simplifying complex concepts into three key takeaways for presentations or reports. Students and researchers can also leverage it to structure their findings or create visual summaries for academic presentations.
One of the most significant advantages of this tool is its ability to overcome creative blocks. The AI-generated content provides a strong starting point, offering inspiration and content that users can then refine and personalize. This not only accelerates the analysis process but also ensures that the final output is concise and focused. The tool’s comprehensive project management features, including cloud saving and local export, provide flexibility and peace of mind. Ultimately, the Three Aspects Infographic Designer empowers users to communicate complex ideas effectively, turning data into powerful, shareable insights.
Conclusion
The Three Aspects Infographic Designer from Visual Paradigm is a sophisticated tool that redefines how professionals visualize and communicate complex information. By combining AI-powered content generation with a user-friendly interface and extensive customization options, it enables users to create professional, engaging infographics in minutes. Whether you are a business strategist analyzing financial performance, a product manager evaluating a new feature, or a marketer simplifying a campaign, this tool provides the means to present your ideas clearly and effectively. The ability to generate, customize, and share infographics with a simple link makes it an indispensable asset for any team or individual focused on strategic communication. To experience the power of this innovative software, visit the official site and start creating your own impactful visuals today.
Try the Three Aspects Infographic Designer now: https://ai-toolbox.visual-paradigm.com/app/three-aspects-infographic-designer/
Related Links
-
AI 5- Aspects Infographic Designer & Generator: AI -Powered 5- Aspects Infographic Designer .The 5- Aspects Infographic Designer guides you through creating comprehensive, animated five-part visuals suitable for complex strategies, models, or transformation roadmaps.
-
AI -Powered 6- Aspects Infographic Designer: AI -Powered 6- Aspects Infographic Designer . Transform Complex Strategies into Stunning Visuals Instantly.The 6- Aspects Infographic Designer leads you through a methodical process for designing compelling six-part infographics tailored to complex strategic communication.
-
8-Aspects Infographic Designer | AI-Powered Strategic …: 8- Aspects Infographic Designer Effortlessly turn 8-factor frameworks into clear, compelling infographics . Powered by AI , this tool supports models like 8P, 8C, and custom 8- aspect analyses, giving you complete control to edit every layout and detail.
-
Create McKinsey 7S Infographics with AI | Visual Paradigm: The Seven Aspects Infographic Designer from Visual Paradigm is the ultimate tool for anyone who needs to visualize complex information. Whether you’re analyzing organizational change, developing a product strategy, or conducting academic research, this AI -powered software makes it fast, easy, and professional.
Comments (0)