How I Automated Conference Planning with AI: A Real-World PERT Chart Breakthrough
Project managers are under pressure to deliver complex plans on time — and traditional scheduling tools just don’t keep up. That’s why I decided to revolutionize how I plan an international conference — from initial concept to final event execution — using AI-powered project modeling.
Why Traditional PERT Charts Are Falling Short
For years, I relied on manual PERT charts to map out the timeline of my biggest projects. The process was slow, error-prone, and required deep familiarity with network diagramming.
Every time I described a project — like organizing a 5-day global tech conference — I had to:
- Break the workflow into phases (planning, marketing, logistics, operations, execution)
- Manually define task dependencies (e.g., ‘Marketing cannot begin until Market Research is complete’)
- Calculate early and late start/finish times using forward and backward passes
- Identify the critical path — the sequence of tasks that determines the project’s minimum duration
Even with spreadsheets, the risk of human error was high. And when changes occurred — like a delay in speaker booking or a shift in venue — recalculating the entire schedule took hours.
Introducing the AI-Powered PERT Chart Generator in Visual Paradigm
After testing several tools, I found that Visual Paradigm’s AI-powered diagram generation engine changed the game. Instead of drawing nodes and arrows by hand, I now describe the project in plain language, and the AI builds a fully structured, professional-grade PERT chart in seconds.
How It Works: From Prompt to Diagram
Here’s the real magic:
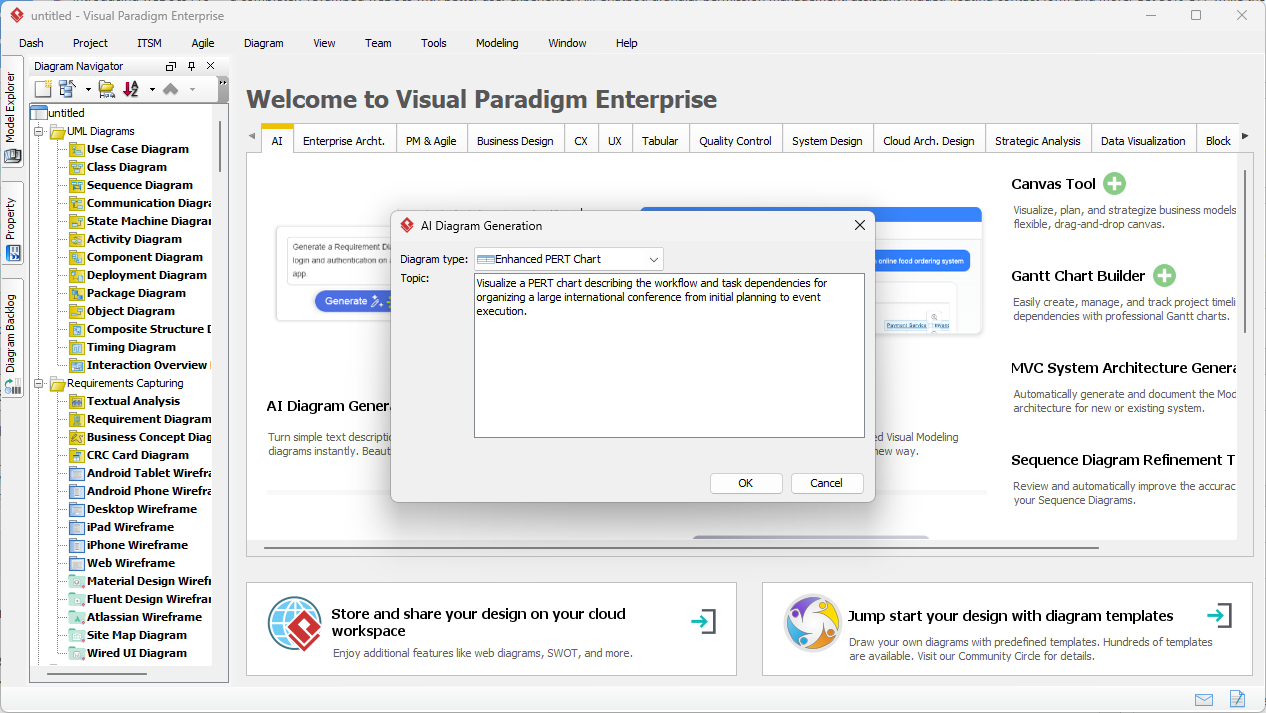
- Input a natural language description: For example, ‘Plan a global tech conference from idea to execution, including market research, speaker booking, venue selection, marketing, and event on-site operations.’
- AI parses dependencies and phases: Automatically groups tasks into logical swimlanes — Planning, Marketing & Promotion, Logistics & Operations, Event Execution — and maps the sequence.
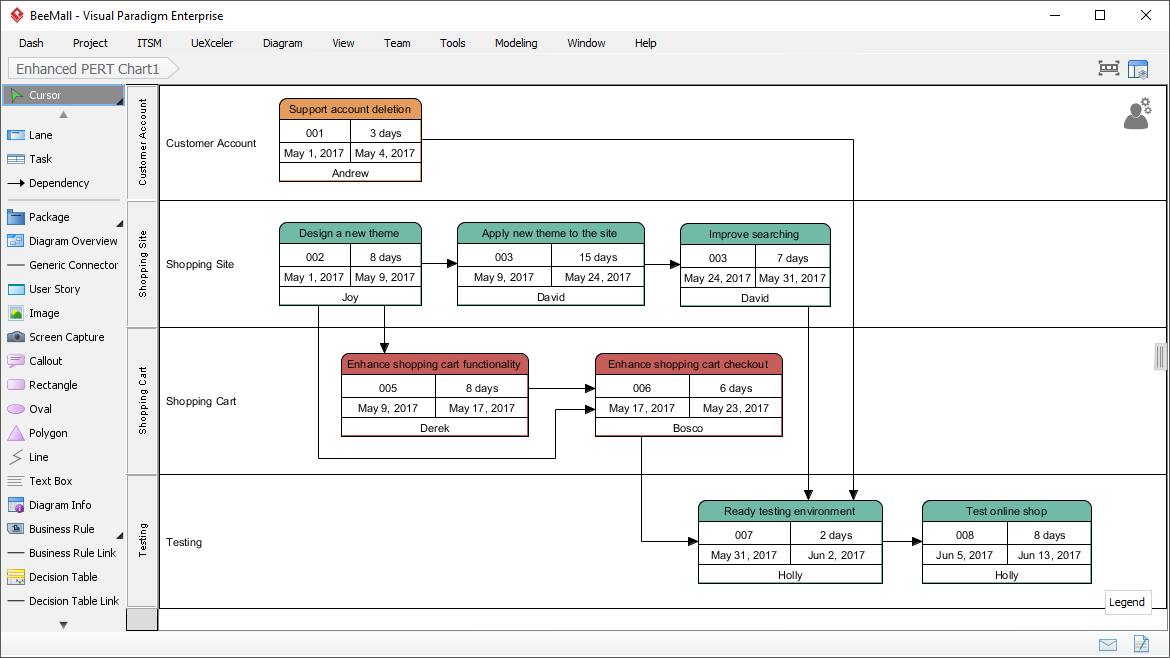
- Generates a visually structured PERT chart: With event nodes (circles/rectangles), activity arrows, task IDs, durations, and personnel assigned (e.g., ‘Alice — Logistics’).
- Applies PERT three-point estimates: Uses the formula
TE = (O + 4ML + P) / 6to calculate expected durations, with built-in support for optimistic, most likely, and pessimistic scenarios.
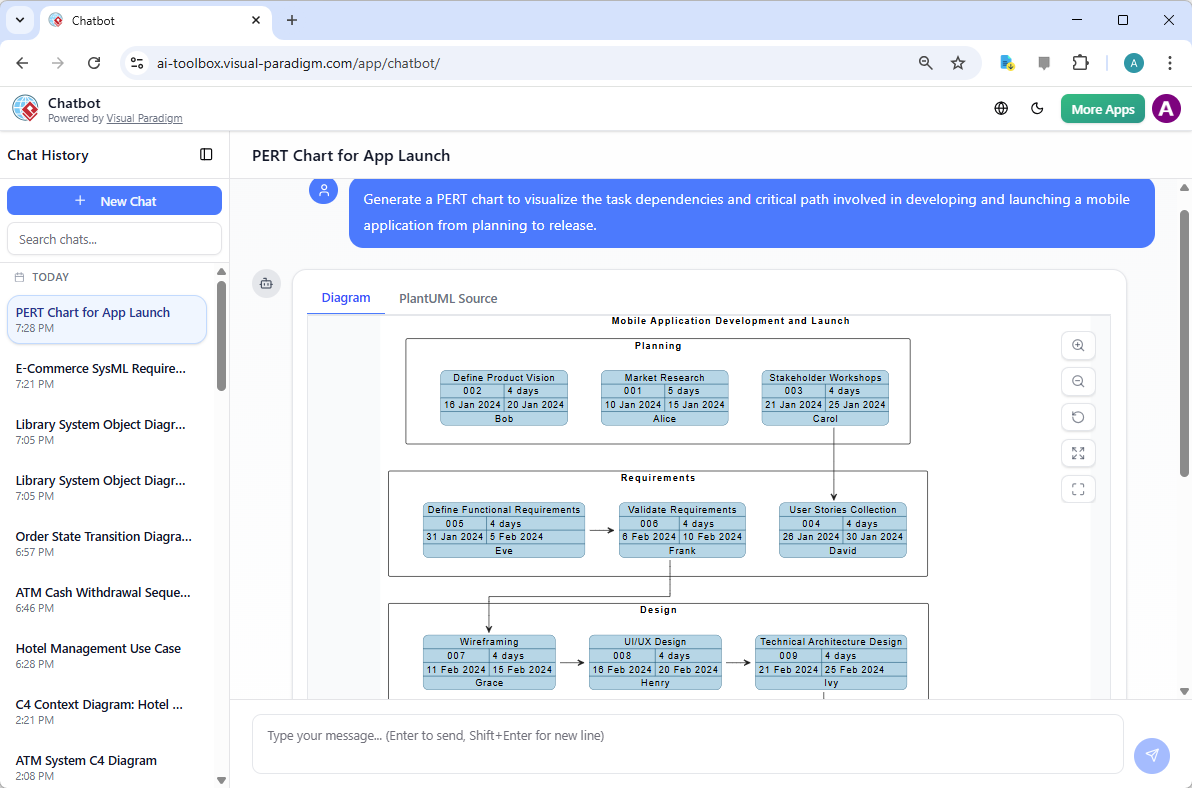
Example: A Mobile App Launch Timeline
Using the same approach for a mobile app launch, the AI identified key phases:
- Market Research (3 weeks)
- Stakeholder Workshops (1 week)
- UI/UX Design (4 weeks)
- Development (12 weeks)
- Testing & QA (2 weeks)
- Launch (1 week)
And it didn’t just list them — it showed dependencies: ‘Stakeholder Workshops must finish before UI/UX begins,’ and clearly highlighted the critical path that spans from research to launch, totaling 21 weeks.
Key Benefits in Practice
Here’s how this tool transformed my workflow — not just in theory, but in actual project delivery.
| Traditional Method | AI-Powered Method |
|---|---|
| Manual node mapping — time-consuming, prone to errors | AI generates structure in seconds based on natural language |
| Manual forward/backward passes — takes 4–6 hours per schedule | Automated calculation of early/late times, slack, and critical path |
| Difficulty identifying bottlenecks or risks | Clear visualization of critical tasks and flexible scheduling paths |
| Slow iteration when scenarios change | Change the prompt — regen the chart in seconds (e.g., add a 2-week delay to logistics) |
Guidelines: Best Practices for Using AI-PERT in Real Projects
Here’s how I ensure the output is not just fast, but also strategic and actionable:
- Start with a clear, dependency-rich description: Include phrases like ‘only begins after,’ ‘must finish before,’ or ‘is parallel to’ to guide the AI.
- Define risk factors in the prompt: E.g., ‘Supply chain delays are likely — add 1 week of lag in logistics phase’.
- Use the AI as a starter draft — not final output: Always refine durations, dependencies, and resource assignments manually before finalizing.
- Generate multiple scenarios: Test best-case, worst-case, and realistic-case timelines to build a robust risk assessment.
- Highlight the critical path: Use color-coding or labels in the tool to emphasize which tasks are non-negotiable.
Key Concepts Every Project Manager Should Know
Understanding the foundation of PERT helps you leverage AI tools more effectively:
- PERT Chart: A project scheduling tool that maps tasks, dependencies, and durations to show the logical flow of work.
- Critical Path: The longest sequence of dependent tasks — any delay here will delay the project’s end date.
- Slack (Float): The amount of time a non-critical task can be delayed without affecting the project timeline.
- Three-Point Estimation: A statistical method to model uncertainty in duration — combining optimistic, most likely, and pessimistic estimates to produce a more accurate expectation.
- Dependency Logic: The core of scheduling — tasks are only valid once their predecessors are complete.
Tip & Trick: The 20/80 Rule — Human Oversight Is Still Essential
While AI handles 80% of the structural work — from node placement to dependency mapping — the human expert must refine the final 20%.
For example:
- Adjust task durations to match team capacity
- Update resource assignments (e.g., assign Alice to speaker booking)
- Modify lags for safety margins on high-risk tasks
- Switch between deterministic (fixed dates) and probabilistic (range-based) estimates
Without this step, the chart risks being technically correct but operationally unrealistic.
Real-World Workflow: From Brainstorm to Stakeholder Presentation
Here’s how I use it in practice:
Phase 1: Concept to Draft (3 minutes)
Describe the project in a single sentence: ‘Organize a 5-day international conference with global speakers, regional logistics, and digital marketing — starting in June.’
Phase 2: Review & Refine (20 minutes)
Review the AI-generated PERT chart:
- Ensure logical flow — e.g., marketing starts after speaker confirmations
- Adjust durations based on team availability
- Set dependencies with lag (e.g., ‘Venue booking has 2-week buffer’)
- Export to PDF or embed in a shared project dashboard
Phase 3: Risk Testing (5 minutes)
Change the prompt to include uncertainty: ‘Add 2 weeks of delay to venue booking due to supply chain risks’.
The AI regenerates the chart, showing a new critical path and extended timeline — a crucial insight for senior leadership.
Why This Matters: The Future of Agile Project Management
AI isn’t replacing project managers — it’s empowering them.
With tools like Visual Paradigm’s AI PERT generator, we shift from being chart-drawers to being strategic planners. We can now:
- Explore what-if scenarios instantly
- Communicate complex timelines to stakeholders with clarity
- Focus on decision-making, not scheduling
- Ensure alignment across departments with visual transparency
Final Thought: The Power of Context
The most powerful thing about AI-generated PERT charts isn’t just that they’re fast — it’s that they preserve the context of the project.
They don’t just show timelines. They show the logic behind them. They capture dependencies, risks, and human elements that were previously hidden in spreadsheets or notes.
And when you combine that with professional standards like PMP-level documentation, three-point estimation, and industry notation — the output becomes not just a schedule, but a decision engine.
Try it yourself. Whether you’re planning a global conference, launching a product, or managing a software team, AI-powered project modeling is no longer a futuristic idea — it’s a proven, day-to-day tool that delivers faster, smarter, and more resilient planning.
Download Visual Paradigm Desktop to access the full AI Diagram Generation suite, or try the AI Chatbot online for quick brainstorming sessions.
Articles and resources related to Visual Paradigm’s AI capabilities and PERT Chart tools for project management:
-
Pert Chart Tool – Visual Paradigm Online: A powerful online tool designed to help project managers visualize task dependencies, estimate timelines, and manage project schedules effectively.
-
Complete PERT Chart Tutorial – Visual Paradigm: A step-by-step tutorial guiding users through creating and using PERT charts in the cloud to plan and manage complex projects efficiently.
-
Pert Chart User Guide – Visual Paradigm: Detailed documentation covering how to create, edit, and utilize PERT charts within the desktop software for robust project management.
-
Free PERT Chart Templates – Visual Paradigm: Access a collection of professionally designed templates to kickstart project planning with minimal setup.
-
Pert Chart Tutorial – Visual Paradigm Knowledge Base: An in-depth resource explaining the purpose, construction, and application of PERT charts in real-world project management scenarios.
-
Enhanced PERT Chart Features – Visual Paradigm: Explore advanced capabilities such as dynamic scheduling, critical path analysis, and seamless integration with project timelines.
-
Project Management Guide – Visual Paradigm User Guide: A comprehensive guide to the platform’s project management suite, including PERT charts, Gantt charts, and resource allocation tools.
-
Pert Chart for Project Management – Cybermedian: This article provides practical insights and real-world online examples for using PERT charts to improve project planning.
-
Integrating PERT Charts with RACI Roles in Task Management: A practical guide on combining PERT charts with RACI roles to enhance timeline accuracy and accountability in management workflows.
-
Visual Paradigm AI Suite: A Comprehensive Guide: This overview details how the platform’s AI Chatbot supports the generation of business diagrams, explicitly including PERT charts, within the modeling environment.


Comments (0)